Long positions on EUR/USD:
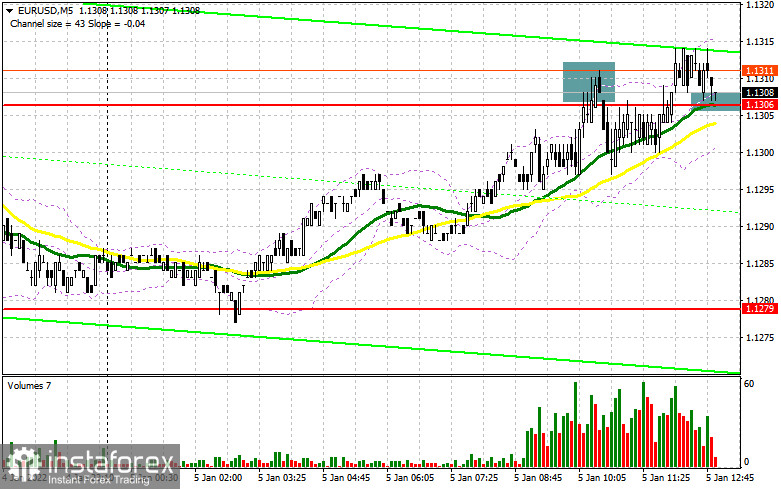
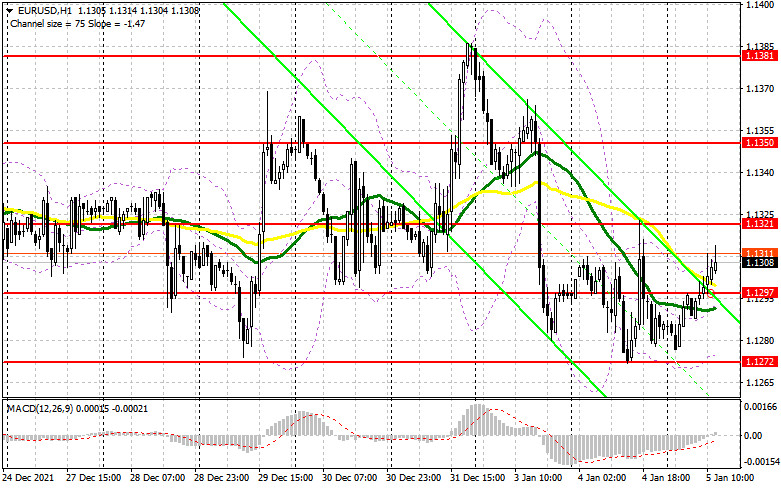
In my analysis this morning I paid attention to the level of 1.1306 and considered entering the market from this level. Let's have a look at the 5-minute chart and analyze the situation. The data, which was released in the first half of the day, had a negative impact on the European currency. As a result, a false breakout at 1.1306 was a sell signal. However, it did not trigger a significant drop in the pair. After a slight decline, bulls attempted to break through 1.1306 and tried to fix the price above this range. Currently, much depends on the fundamental data from the US. The technical picture has also changed in the second half of the day.
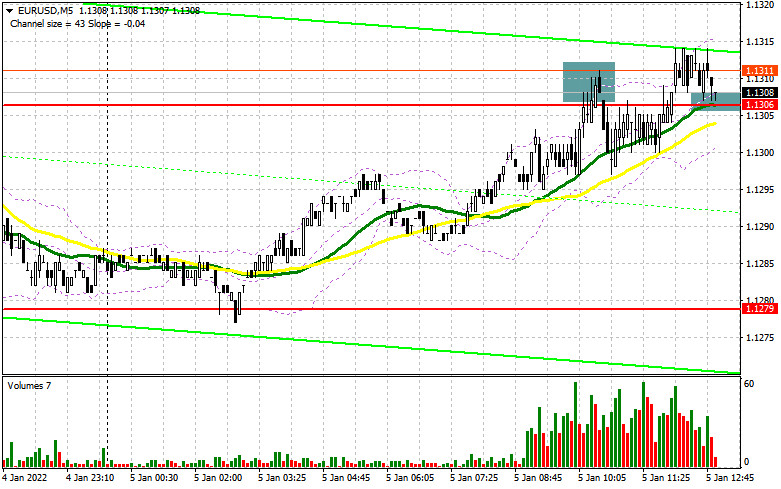
A reverse test of 1.1306 top/bottom created a buy signal for the euro, and while trading will be carried out above this level, we can expect a larger rise in the EUR/USD pair towards yesterday's highs. Bulls have a new resistance at 1.1321, but in order to break through it, they need weak data on the US economy and more activity in the market. The ADP Non-Farm Employment Change and Services PMI are expected. Weak data, similar to yesterday, may increase the pressure on the dollar. In case the pair declines, only the formation of a false breakout near new support at 1.1297 could give a buy signal for the euro, counting on a rebound towards resistance at 1.1321. A breakthrough of this level is no less important. A reversal test top/bottom may pave the way to the new levels: 1.1350 and 1.1381, where traders can take profit. The next target is 1.1415. In case of a larger decline in the pair during the US session and if bulls show weak trading activity at 1.1297, below this level the moving averages are located, playing on the bulls' side, it is better to refrain from purchases till the price reaches support at 1.1272. This level is very important for bulls, so we can expect an active rise in the pair from this range. However, I would recommend opening long positions there if a false breakout occurs. The last hope of bulls to maintain the price within the ascending channel is its lower boundary at 1.1248, from which long positions could be opened for the immediate rebound, allowing an upward intraday correction by 20-25 pips.
Short positions on EUR/USD:
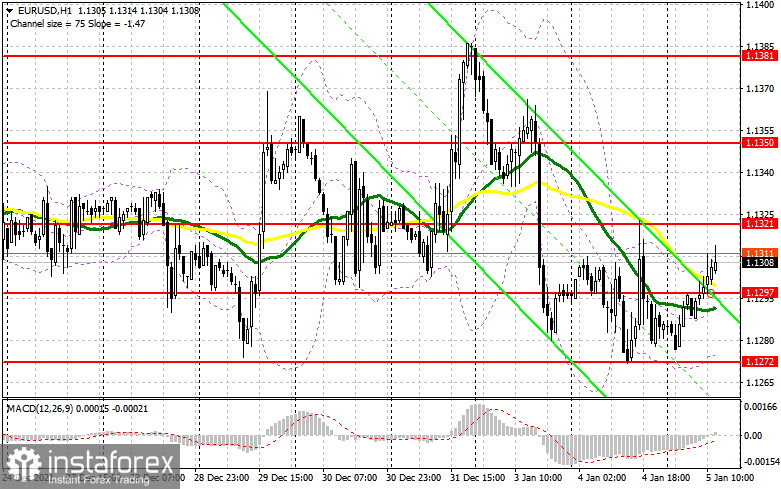
If the pair continues its growth, bears have to try to do their best to hold the price below resistance at 1.1321. Only strong US economic data may discourage euro buyers from dragging the price towards this level. The first entry point for short positions is after a false breakout at 1.1321, allowing the pair to go down to 1.1297 under pressure. A lot will depend on this level. A breakthrough and a reverse test bottom/top may create an additional signal for opening short positions with the prospect of the pair's decline to support at 1.1272. Once the price pierces this level, it will trigger buyers' stop-loss orders and cause a larger decline in the pair, with testing of new lows at 1.1248 and 1.1224, where traders may consider taking profits. In case the pair grows after weak fundamental data from the US and publication of the Fed meeting minutes, as well as in the case of the lack of activity from bears at 1.1321, it is better to postpone selling the pair. The optimal scenario would be to open short positions if a false breakdown is formed near 1.1350. Traders may sell the pair on the rebound from the high at 1.1381, or even higher, near 1.1415, allowing a downward correction by 15-20 pips.
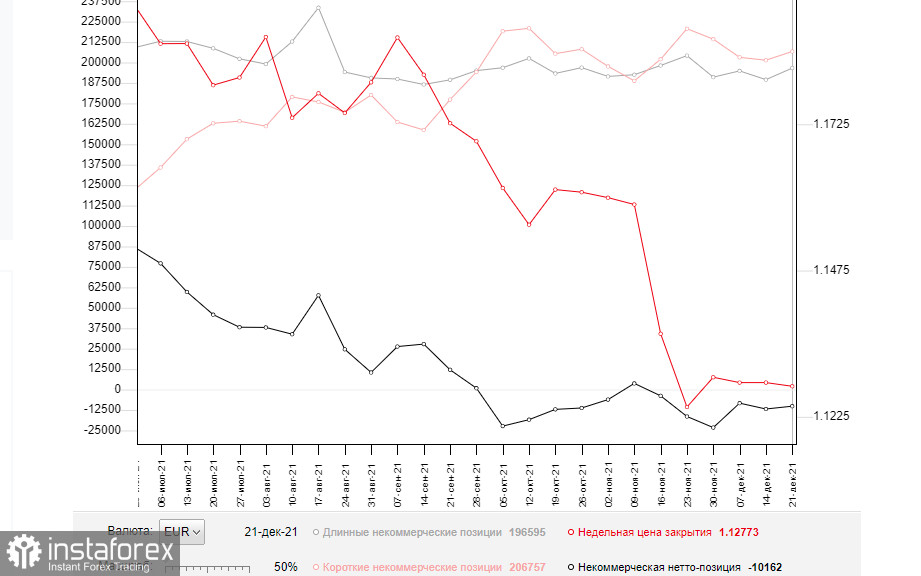
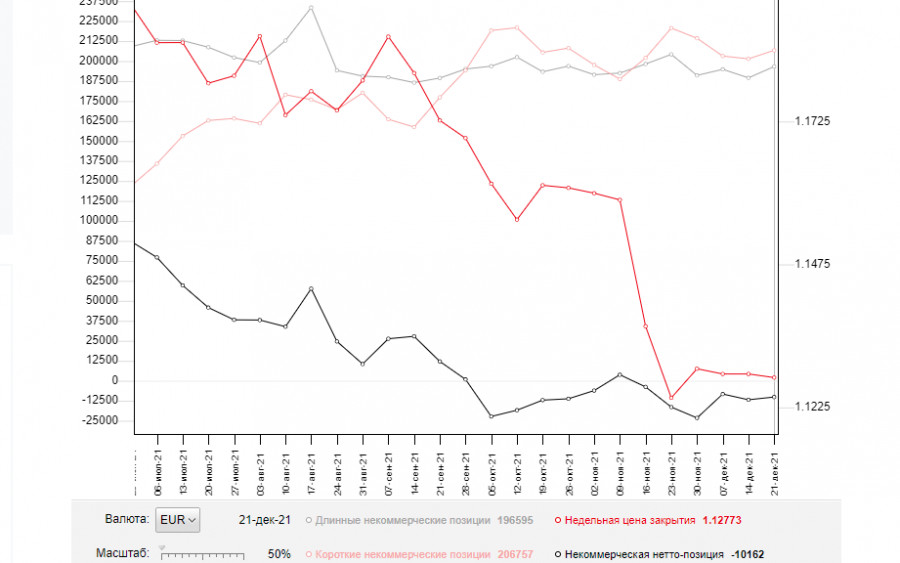
The COT (Commitment of Traders) report for December 28 showed an increase in both short and long positions, but the latter declined slightly more, which led to a reduction in the negative delta. This data takes into account the recent meetings of the Fed and the ECB. However, judging by the balance of open positions, not much has changed, and the chart proves this. Many problems in the economies of the eurozone and the US remain due to the outbreak of Omicron, which makes the situation worse for the regulators. Most likely, the monetary policy of the Fed and the ECB will depend on how the situation with coronavirus develops after the New Year. The report shows that buyers of risky assets, and we are now talking about the euro, are not so active in terms of opening long positions, even after the recent statements of the European Central Bank that it plans to completely wind down its program of emergency bond purchases in March. On the other hand, the US dollar also has support as the Fed plans to raise interest rates as early as next spring, which makes the US dollar more attractive. The COT report showed that long non-commercials rose to 196,595 from 189,530, while short non-commercials rose to 206,757 from 201,409. This suggests that traders may try to take control of the market trend. At the end of the week, the total non-commercial net position decreased its negative value to -10,162 from -11,879. The weekly closing price, due to the sideways channel, was almost unchanged, which is 1.1277 against 1.1283 a week earlier.
Signals of indicators:
Moving Averages
Trading is carried out near 30 and 50 daily moving averages, which indicates that the pair is trading within a sideways channel.
Note: The period and prices of moving averages are considered by the author on the hourly chart H1 and differ from the general definition of the classic daily moving averages on the daily chart D1.
Bollinger Bands
The market volatility is very low, so there are no signals for entering the market based on the indicator.
Description of indicators
- Moving average (moving average determines the current trend by smoothing out volatility and noise). Period 50. The graph is marked in yellow.
- Moving average (moving average determines the current trend by smoothing out volatility and noise). Period 30. The graph is marked in green.
- MACD indicator (Moving Average Convergence / Divergence - moving average convergence/divergence) Fast EMA period 12. Slow EMA period 26. SMA period 9
- Bollinger Bands (Bollinger Bands). Period 20
- Non-profit speculative traders, such as individual traders, hedge funds, and large institutions that use the futures market for speculative purposes and meet certain requirements.
- Long non-commercial positions represent the total long open position of non-commercial traders.
- Short non-commercial positions represent the total short open position of non-commercial traders.
- Total non-commercial net position is the difference between the short and long positions of non-commercial traders.