Analysis of Tuesday's trades:
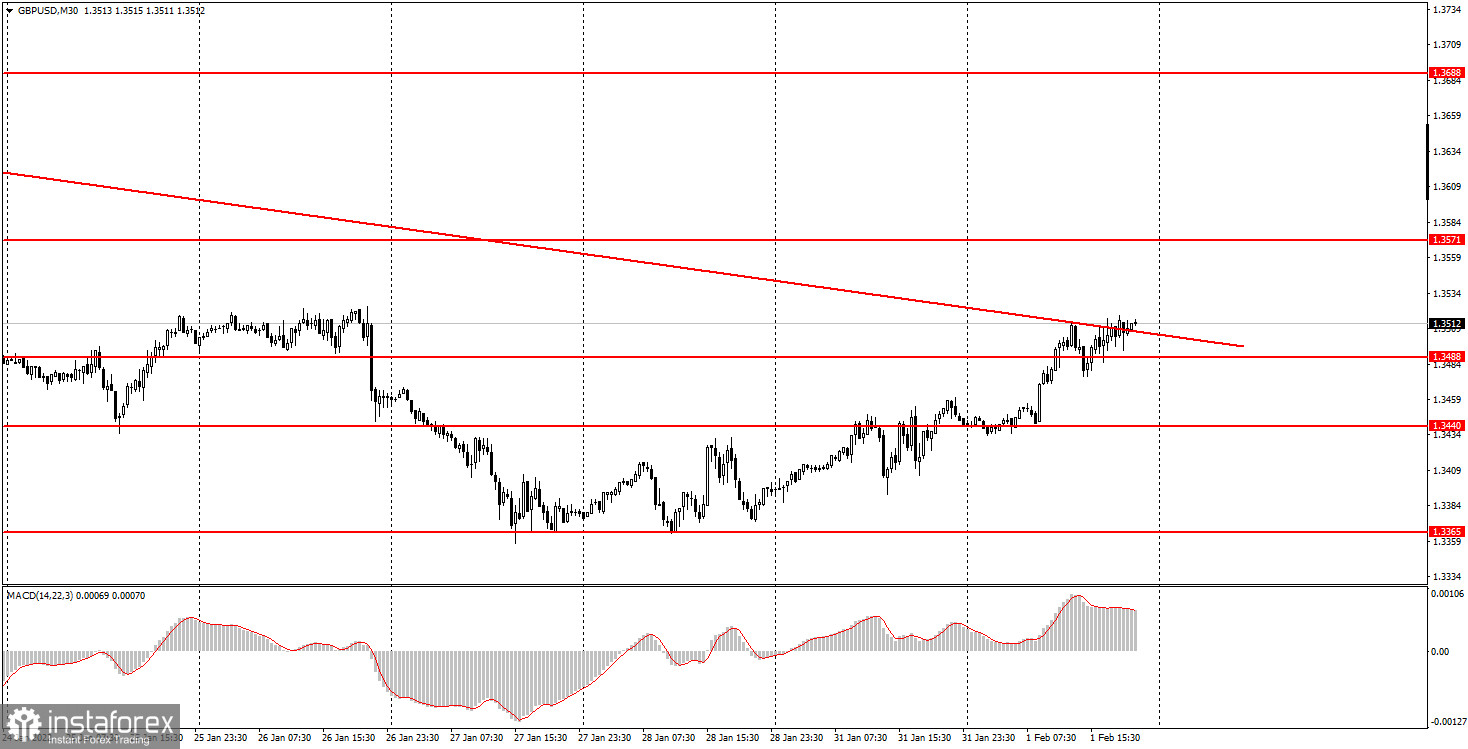
30M chart of GBP/USD
On Tuesday, February 1st, GBP/USD was trading mixed. The trend discrepancies could be seen in both 5M and 30M time frames. Remarkably, the pair has managed to approach the downward trend line. At first, the price rebounded from it, but on the second try, the line was broken. It was a rather unclear and contradictory move as the pair has advanced 5 pips and held steady thereafter, being stuck at the trend line for 5-6 hours. So, we cannot say for sure whether it has been a break or a rebound. Probably, both these variants are wrong. It is unclear if the British currency will extend its gains, especially ahead of the BOE policy meeting. It will be held tomorrow and the results will be revealed on Thursday afternoon. This factor should be kept in mind. As for today's developments, the only macroeconomic report worth investors' attention was the ISM manufacturing PMI. However, it attracted feeble interest, so the pound/dollar movements were shaped by technical factors.
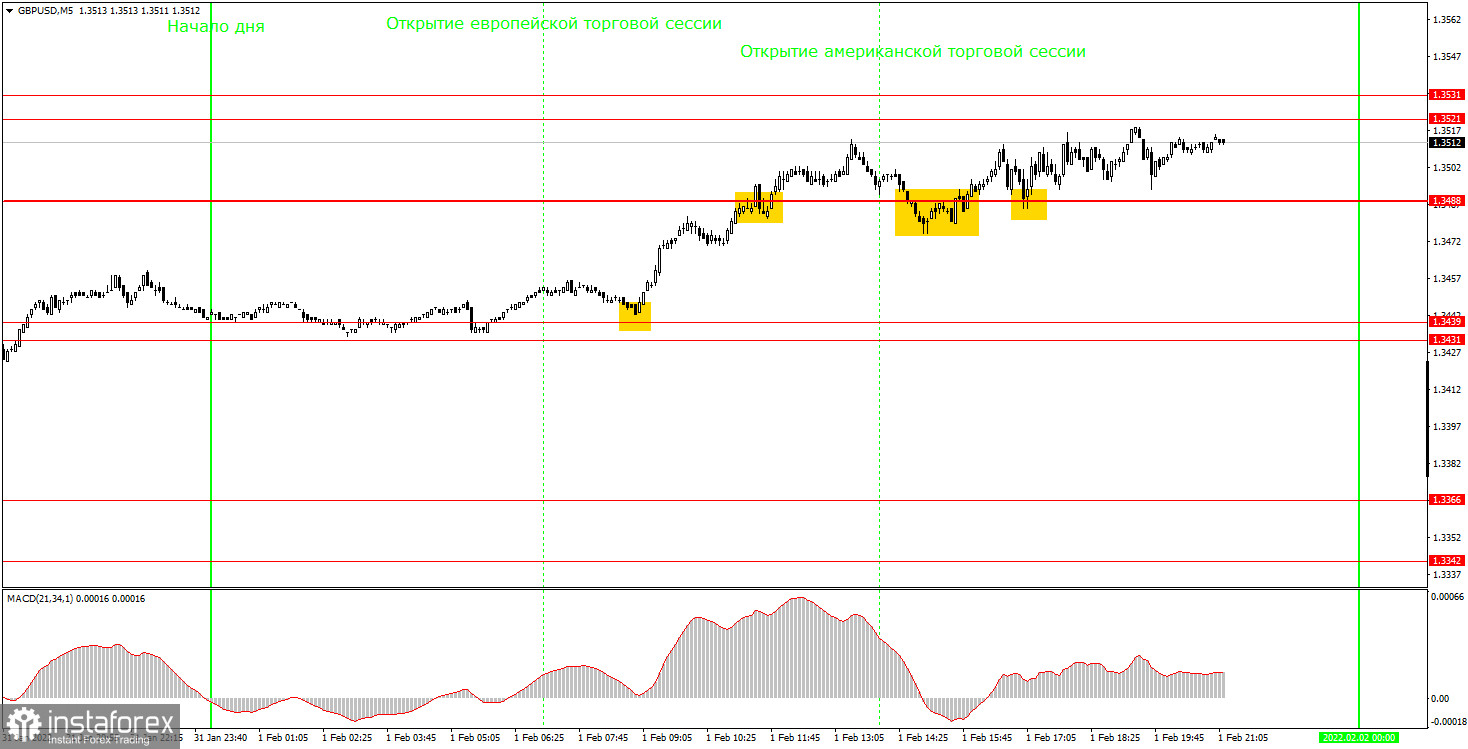
5M chart of GBP/USD
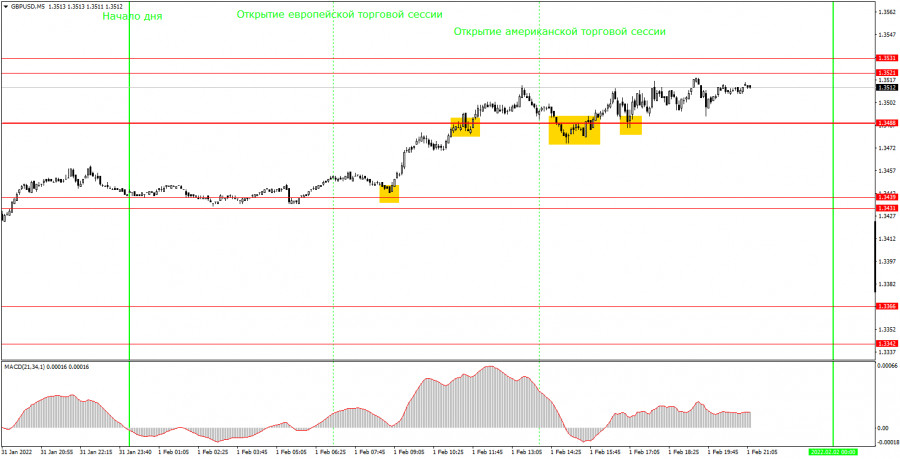
The 5M time frame also provided a confusing picture. Yesterday, I thought the levels of 1.3431 and 1.3439 to be no longer valid as the price passed through them in both directions. However, it has turned out there are simply no other levels in this area. So we have a contradictory situation: either to keep these levels for the next day or simply refrain from opening any positions at the moment. If we choose to stick to these levels, then we should pay attention to an off-target buy signal formed in the early European session. There was a 3-pips discrepancy, and before that, the price rebounded from this area twice. So, it was still safe to open buy positions at the opening of the European trades. To mitigate risks, long trades were hedged as the downward scenario remained valid. Afterward, the pair rose to 1.3488, broke it, and started fluctuating near the trend line on the 30M time frame. So, it was reasonable to close long positions and wait for the price clearly breaking the trend line. Surprisingly, the cable broke below 1.3488 in the early American session, thus forming a false sell signal. Beginning traders might have suffered a loss of 15 pips following such a signal. Overall, the situation was mixed today, causing different trading results.
Trading plan for Wednesday, February 2nd
In the 30M time frame, the downward trend seems to remain valid. However, the pair needs to end the correction and stay below the trend line to keep falling. On Wednesday, volatility is likely to be moderate, whereas Thursday and Friday may produce choppy trading. So, the situation on Wednesday may be confusing again with no clear signals. The target levels in the 5M time frame may be found at 1.3431-1.3439, 1.3488, 1.3521-1.3531, 1.3572, and 1.3598-1.3603. The British economic calendar lacks any important releases while the United States will unveil the ADP report that has been of minor interest lately. So, the macroeconomic and fundamental backgrounds will be weak.
The basic principles of the trading system:
1) The strength of the signal depends on the time period during which the signal was formed (a rebound or a break)/ The shorter this period, the stronger the signal.
2) If two or more trades were opened at some level following false signals, i.e. those signals that did not lead the price to Take Profit level or the nearest target levels, then any consequent signals near this level should be ignored.
3) During the flat trend, any currency pair may form a lot of false signals or do not produce any signals at all. In any case, the flat trend is not the best condition for trading.
4) Trades are opened in the time period between the beginning of the European session and until the middle of the American one when all deals should be closed manually.
5) We can pay attention to the MACD signals in the 30M time frame only if there is good volatility and a definite trend confirmed by a trend line or a trend channel.
6) If two key levels are too close to each other (about 5-15 pips), then this is a support or resistance area.
How to interpret a chart:
Support and Resistance price levels can serve as targets when buying or selling. You can place Take Profit levels near them.
Red lines are channels or trend lines that display the current trend and show which direction is better to trade.
MACD indicator (14,22,3) is a histogram and a signal line showing when it is better to enter the market when they cross. This indicator is better to be used in combination with trend channels or trend lines.
Important speeches and reports that are always reflected in the economic calendars can greatly influence the movement of a currency pair. Therefore, during such events, it is recommended to trade as carefully as possible or exit the market in order to avoid a sharp price reversal against the previous movement.
Beginning traders should remember that every trade cannot be profitable. The development of a reliable strategy and money management are the key to success in trading over a long period of time.