Conditions for opening long positions on EUR/USD:
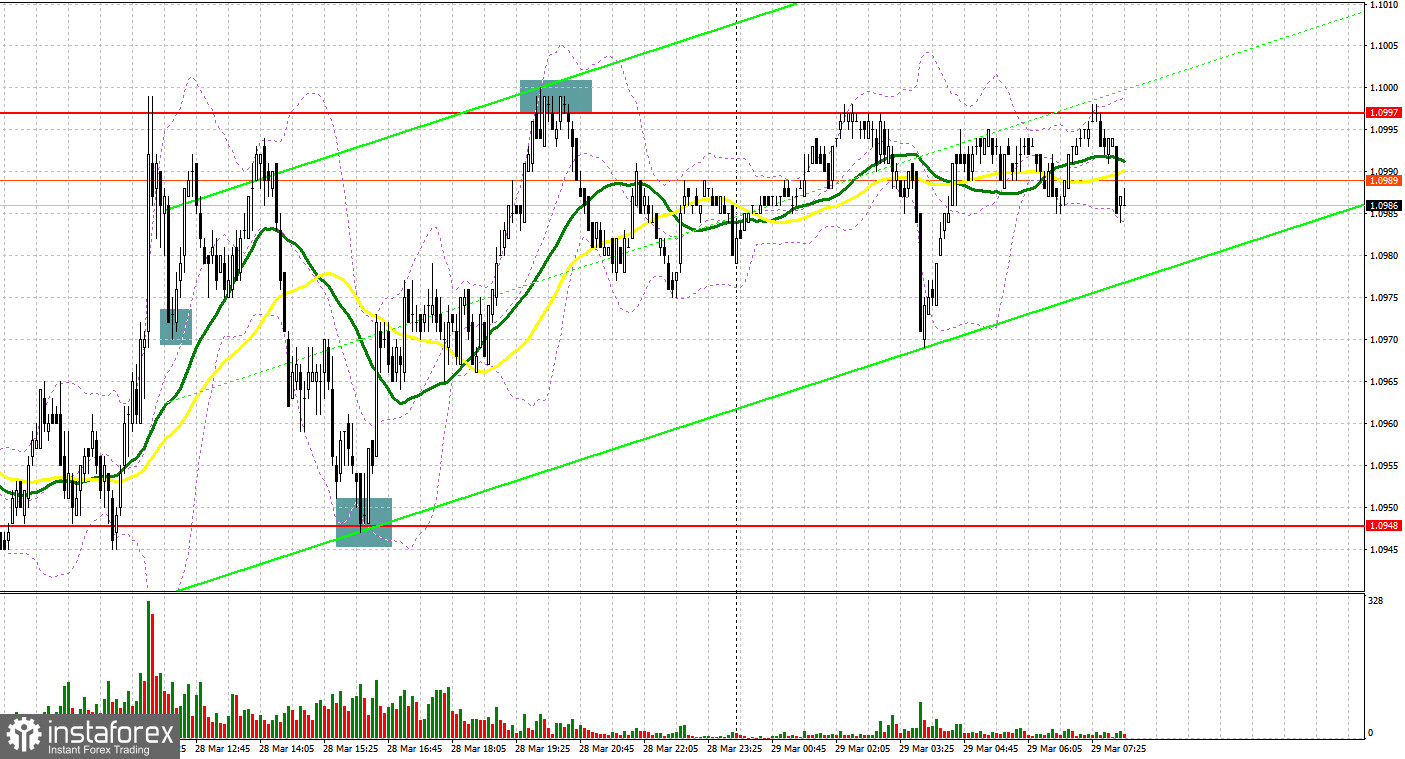
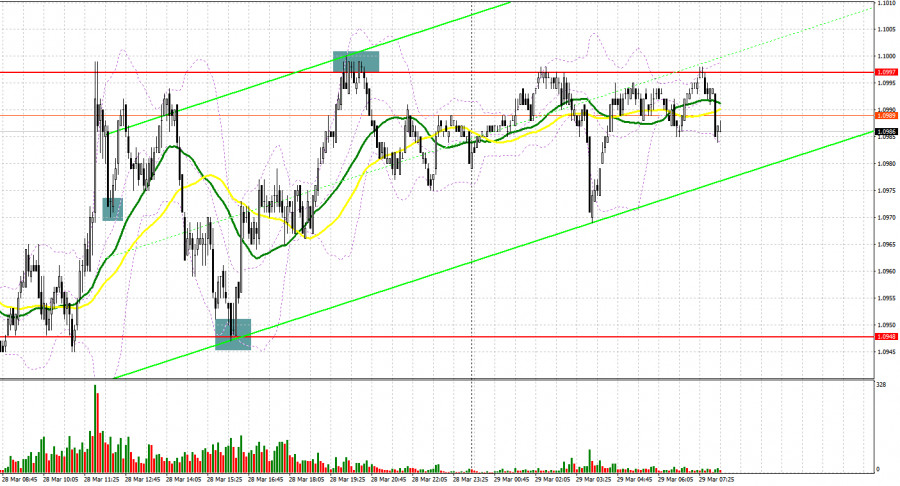
Yesterday, traders received three signals to enter the market, which allowed them to earn money. Let us take a look at the 5-minute chart to analyze the market situation. Earlier, I asked you to focus on the level of 1.0972 to decide when to enter the market. In the first part of the day, we saw a surge in volatility caused by the absence of macroeconomic events. As a result, the pair broke and consolidated above 1.0972. A downward test of this level gave a good long signal. However, the pair showed just a 20-pip increase. In the second part of the day, the price once again declined to 1.0948 and formed a false break. Against this background, I recommended opening long positions. Thus, the pair jumped by more than 50 pips to the nearest resistance level of 1.0997. An unsuccessful attempt to consolidate above this area during the US trade gave a sell signal. As a result, the pair lost 20 pips.
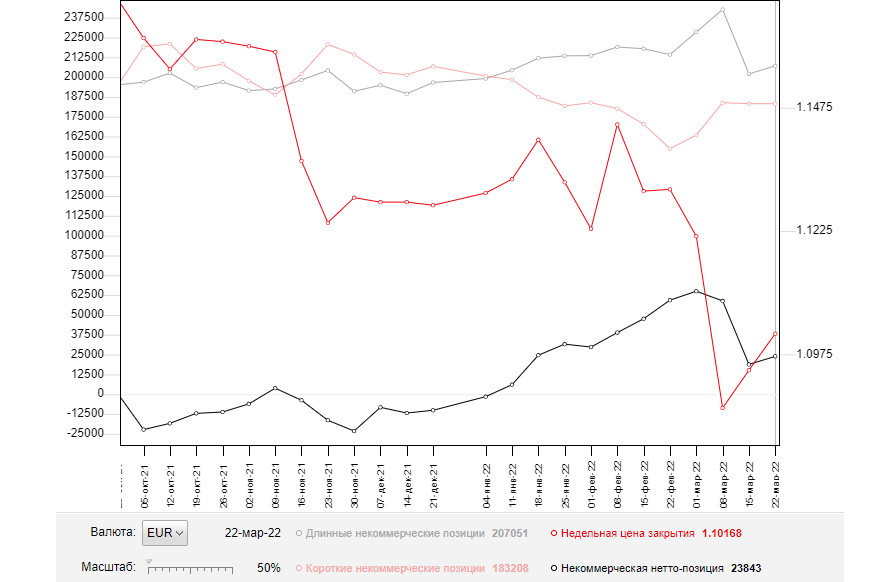
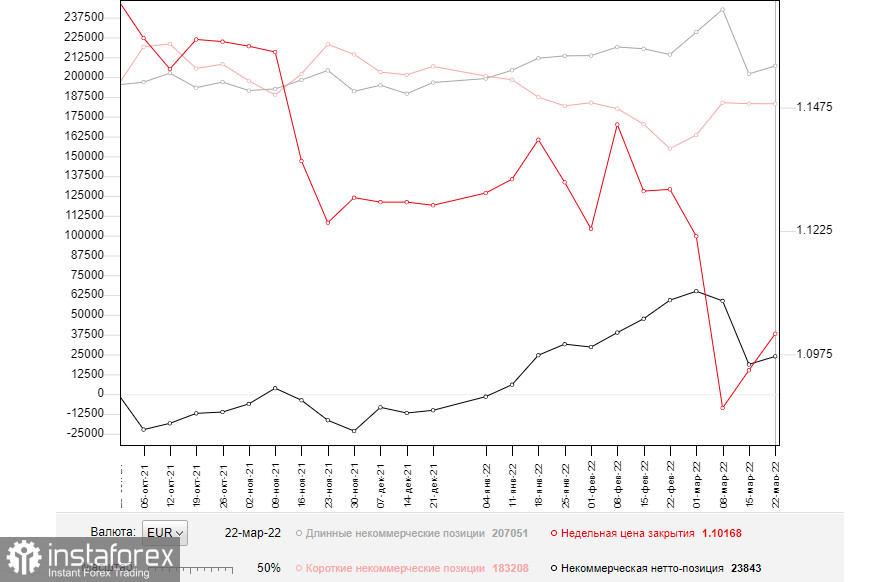
Before we continue analyzing the euro/dollar pair, let us take a look at the futures market and at the COT report. According to the COT report from March 22, the number of short positions declined, whereas the number of long positions soared. The pair's hovering near yearly lows and a strong support level had a positive effect on the euro. However, judging by the figures, a drop in the number of short positions was insignificant. Pressure on the euro/dollar pair returned after a small pause caused by Jerome Powell's announcement about a more hawkish stance of the Fed. On Monday, the Fed Chair said that the regulator was planning to raise the benchmark rate by 50 basis points at the following meeting. The same comments were provided by other representatives of the Federal Reserve. As a result, some market participants have revised their forecasts.
The regulator has to resort to such sharp changes due to the risk of further inflation growth. Not so long ago, Christine Lagarde also unveiled the ECB's plan for a more aggressive QE tapering and the key interest rate hike. The news has a positive influence on the euro in the mid term. Notably, the single currency is significantly oversold against the US dollar. Good results of the Russia-Ukraine negotiations and lower geopolitical tension may encourage buyers of the euro. The COT report disclosed that the number of long non-commercial positions advanced to 207,051 from 202,040, whereas the number of short non-commercial orders declined to 183,208 from 183,246. A weekly close price inched up to 1.1016 from 1.0942.
During the European session, we will hardly see any important fundamental data. However, traders should pay attention to the German consumer climate indicator and import prices. If the final data exceeds forecasts, the price may break the 10th figure and return to the upper limit of the sideways channel located at 1.1036. Early this week, representatives of Russia and Ukraine are planning to meet. Traders expect progress in the negotiations, which will encourage buyers of risk assets.
Today, bulls should primarily protect the support level of 1.0948. Yesterday, a touch of this level provided traders with several good signals to open long positions. The pair may return to this level amid weak macroeconomic figures. However, only a false break will give the first signal to buy the euro. In this case, the pair will have a chance to rise to 1.0997. A downward break of this level will give a buy signal, thus allowing the pair to recover to 1.1036. This is the upper limit of the sideways channel formed last week. A farther target is located at the high of 1.1116. If the price falls and bulls fail to protect 1.0948, it will be wise to avoid long positions. It is possible to open long positions after a false break of the low of 1.0903. Traders may also go long from 1.0855, expecting a rise of 30-35 pips.
Conditions for opening short positions on EUR/USD:
Yesterday, sellers failed to protect the necessary levels and now they may lose control over the market. Until the price hovers below 1.0997, it has every chance to decline deeper. Once bears lose this level, the situation will change dramatically. A false break of 1.0997 amid weak eurozone data may cause a sell signal with the target at 1.0948. A break of 1.0948 may give an additional signal to open short positions with the target at the low of 1.0903. A farther target is located at 1.0948, where it is recommended to lock in profits. If the euro rises and bears fail to protect 1.0997, bulls will continue opening long positions, expecting a return to monthly highs. Since a lot depends on the geopolitical situation, it is better not to bet on the euro's appreciation. It will be wise to open short orders after a false break of 1.1036. It is also possible to sell the euro from 1.1069 or 1.1116, expecting a drop of 20-25 pips.
Signals of indicators:
Moving Averages
Trading is conducted just below the 30- and 50-day moving averages, which indicates that bears are still controlling the market. .
Note: The period and prices of moving averages are considered by the author on the one-hour chart that differs from the general definition of the classic daily moving averages on the daily chart.
Bollinger Bands
If the price rises, the upper limit of the indicator located at 1.0960 will act as a resistance level. In case of a decline, the lower limit of 1.1000 will act as a support level.
Description of indicators
- Moving average (moving average, determines the current trend by smoothing volatility and noise). The period is 50. It is marked in yellow on the chart.
- Moving average (moving average, determines the current trend by smoothing volatility and noise). The period is 30. It is marked in green on the graph.
- MACD indicator (Moving Average Convergence/Divergence - convergence/divergence of moving averages). A fast EMA period is 12. A slow EMA period is 26. The SMA period is 9.
- Bollinger Bands. The period is 20.
- Non-profit speculative traders are individual traders, hedge funds, and large institutions that use the futures market for speculative purposes and meet certain requirements.
- Long non-commercial positions is a total number of long positions opened by non-commercial traders.
- Short non-commercial positions is a total number of short positions opened by non-commercial traders.
- The total non-commercial net position is a difference in the number of short and long positions opened by non-commercial traders.