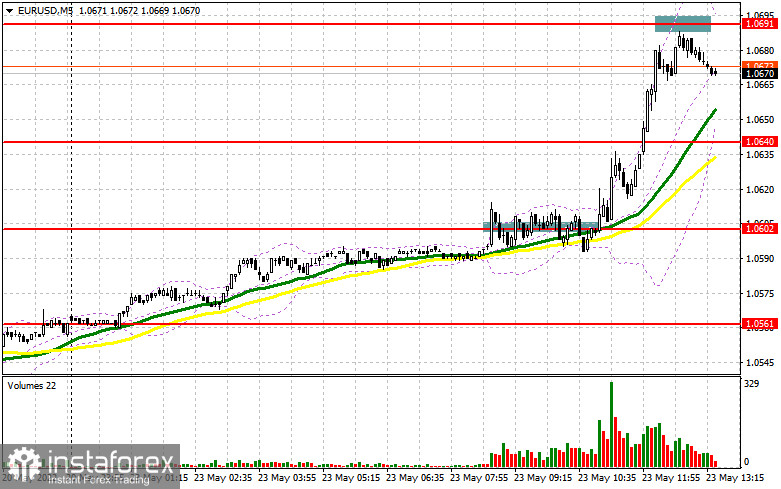
In the morning article, I highlighted the level of 1.0602 and recommended taking decisions with this level in focus. Now let's look at the 5-minute chart and try to figure out what actually happened. Although a breakout of this level occurred, the price was hovering around 1.0602. Traders were expecting a consolidation above this level. For this reason, there was no clear buy signal. Hence, I did not open long positions near the high of 1.0691. Traders also did not open short positions for a bounce from this level as the pair lacked a few points to test the level.
What is needed to open long positions on EUR/USD
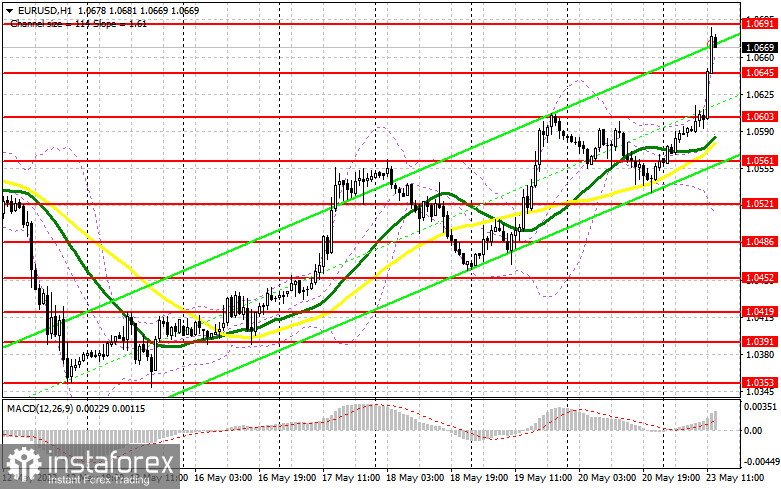
For the second half of the day, the technical outlook has changed slightly. Bulls are unlikely to push the euro/dollar pair above the resistance of 1.0691. In the American session, the economic calendar is almost empty. Traders will take notice of the speech of Fed policymaker Rafael Bostic. The pair may rise higher. Before that, I would like to get clear entry points into the market. The most optimal scenario suggests purchases near the support level of 1.0645. I am going to focus on this level today. If the euro declines to 1.0645 after Bostic's speech on the Fed's plans on monetary policy, only a false breakout there will give a new buy signal. It will also signal a further rise, perhaps above the resistance level of 1.0691. A new bug signal will appear after a breakout and a downward test of this level. If so, they may approach a high of 1.0736 where I recommend locking in profits. A more distant target will be the 1.0775 level. If the price declines and bulls show no activity at 1.0645, which is unlikely as there are no drivers for such a jump, the pressure on the pair will quickly return. Traders will start opening short positions, locking in profits. It is better to open long positions after a false breakout near the high of 1.0603. I would advise you to open long positions immediately at a bounce from the 1.0561 level or a low around 1.0521, keeping in mind an upward intraday correction of 30-35 pips.
What is needed to open short positions on EUR/USD
If the price advances, only a false breakout of 1.0691 will give a new sell signal. The price may retreat to the support level of 1.0645. Notably, bears missed this level this morning. Bulls and bears are likely to tussle for this level. Bulls will not miss the opportunity to increase long positions amid a sharper upward movement. Therefore, a new sell signal will appear only after a breakout and a drop below this level, as well as an upward test. It will erase buyers' stop orders. As a result, the pair could fall drastically to 1.0603, which is today's opening level. I would recommend traders to lock in profits there. The 1.0561 level will be a more distant target. The pair may reach this level only after a full defeat of buyers at the beginning of this week. If the pair advances in the afternoon and bears show no energy at 1.0691, the uptrend may continue. If so, it will strengthen the bullish trend that is currently being unfolded. In this case, it is better to open short positions after a false breakout of 1.0736. You can sell EUR/USD immediately at a bounce from 1.0775 or even a high around 1.0811, keeping in mind a downward intraday correction of 30-35 pips.
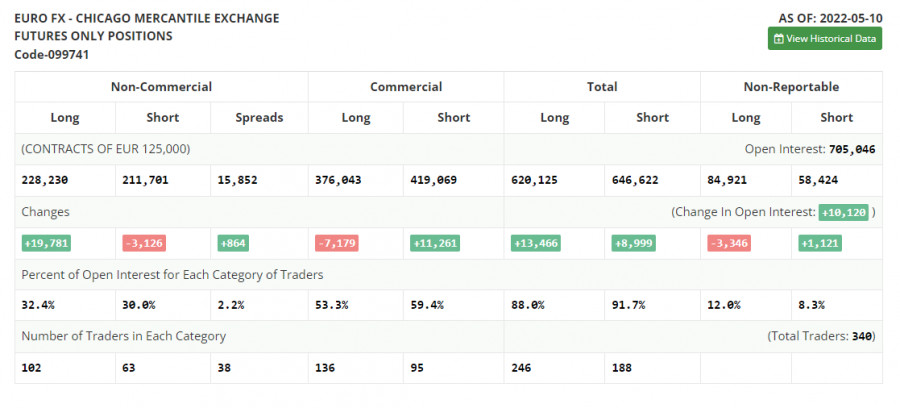
COT report
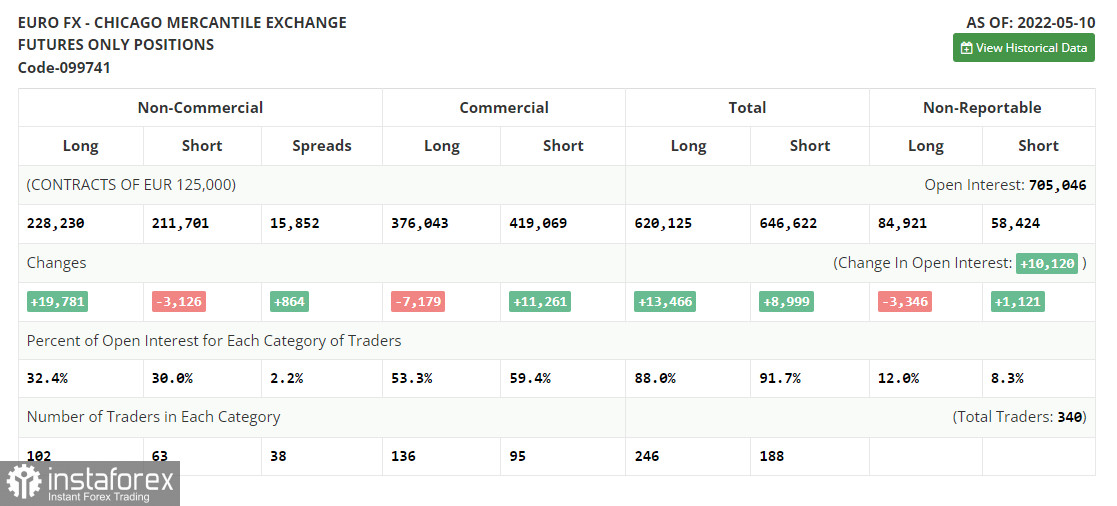
The COT report (Commitment of Traders) for May 10 logged a sharp rise in the number of long positions and a drop in short ones. The euro is oversold, which indicates the accumulation of long positions by market participants. The recent statements of ECB policymakers may also facilitate the formation of a new upward cycle. The ECB Governing Council is widely expected to raise the deposit rate by a quarter-point in July this year followed by rate hikes in September and in December. The regulator is supposed to raise the interest rate to 0.25% by the end of the year. Analysts believe that the ECB may hike the cash rate in September and December to 0.5% from the current zero level. Such an aggressive tightening will help the euro to hit the bottom in the near future. However, the Fed's monetary policy and a further escalation of geopolitical tensions may undermine such a scenario. The US central bank is also planning to aggressively raise the key rate. Some economists reckon that the watchdog may raise the interest rate by 0.75% at the next meeting. If so, it is likely to boost the appeal of the US dollar in the medium term. The COT report revealed that the number of long non-commercial positions increased by 19,781 to the level of 228,230 from the level of 208,449. The number of short non-commercial positions dropped by -3,126 to the level of 211,701 from the level of 214,827. As I have already mentioned, the weaker euro is more attractive to traders and it is clearly seen by a rise in long positions. At the end of the week, the total non-commercial net position jumped to 16,529 against a negative value of -6,378 a week earlier. The weekly closing price was almost unchanged and amounted to 1.0546 against 1.0545.
Signals of technical indicators
Moving averages
EUR/USD is trading slightly above 30- and 50-period moving averages. It means that the euro is likely to climb higher. Remark. The author is analyzing the period and prices of moving averages on the 1-hour chart. So, it differs from the common definitionof classic daily moving averages on the daily chart.
Bollinger Bands
In case of a decline, the lower border around 1.0521 will act as support.
Definitions of technical indicators
- Moving average recognizes an ongoing trend through leveling out volatility and market noise. A 50-period moving average is plotted
- yellow on the chart.
- Moving average identifies an ongoing trend through leveling out volatility and market noise. A 30-period moving average is displayed as the green line.
- MACD indicator represents a relationship between two moving averages that is a ratio of Moving Average Convergence/Divergence. The
- MACD is calculated by subtracting the 26-period Exponential Moving Average (EMA) from the 12-period EMA. A 9-day EMA of the MACD called the "signal
- line".
- Bollinger Bands is a momentum indicator. The upper and lower bands are typically 2 standard deviations +/- from a 20-day simple moving average.
- Non-commercial traders - speculators such as retail traders, hedge funds, and large institutions who use the futures market for speculative purposes and meet certain requirements.
- Non-commercial long positions represent the total long open position of non-commercial traders.
- Non-commercial short positions represent the total short open position of non-commercial traders.
- The overall non-commercial net position balance is the difference between short and long positions of non-commercial traders.