Conditions for opening long positions on EUR/USD:
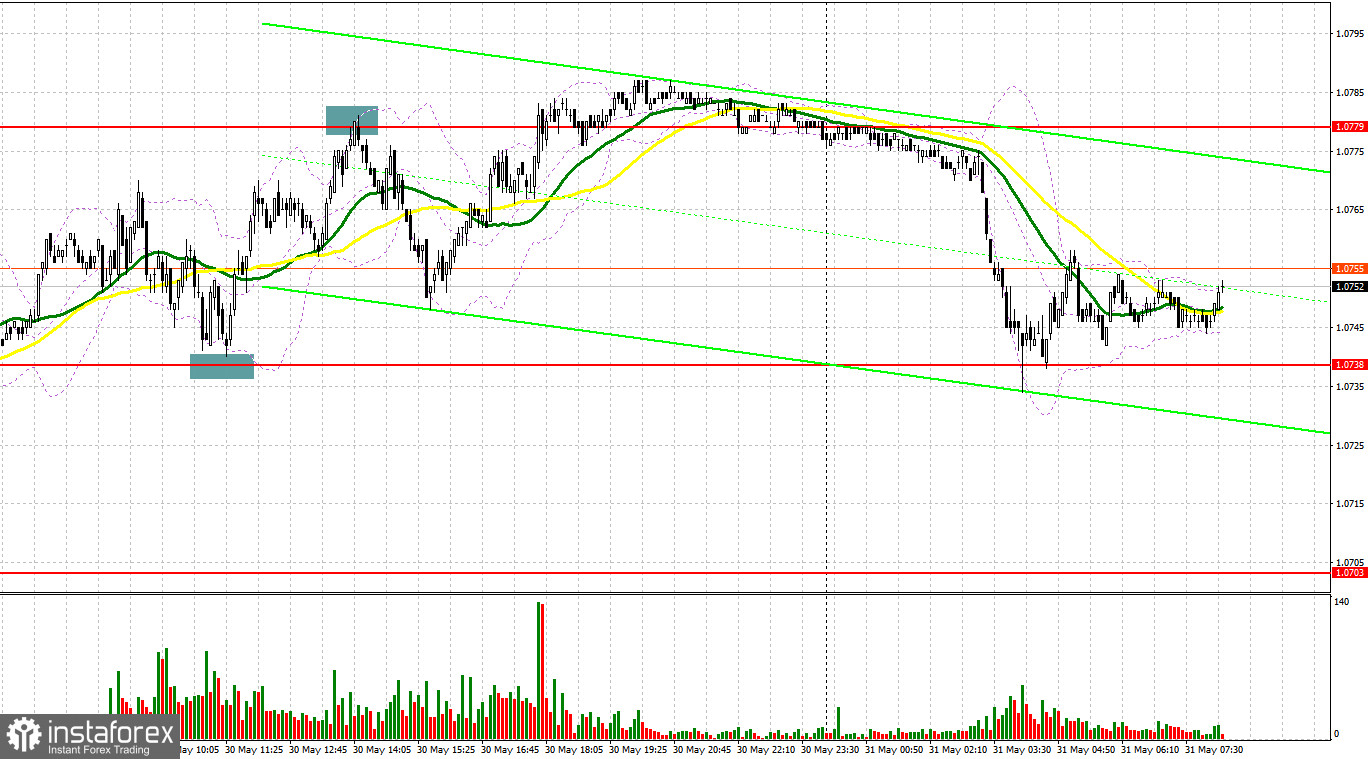
Yesterday, traders received several signals to open long positions. Let's take a look at the 5-minute chart to clear up the market situation. Earlier, I asked traders to pay attention to the level of 1.0738 to decide when to enter the market. On the 5-minute chart, we see that the euro quickly returned to the support level of 1.0738, but it did not test it. That is why I missed the formation of a false break and a buy signal. Those who decided not to wait for a test of 1.0738 and entered the market a bit earlier, could have received perfect results. For the second part of the day, the technical picture is the same. After a rise and an unsuccessful attempt to consolidate above 1.0779, bears got a perfect signal to sell the euro, which brought 30 pips. Unfortunately, the pair failed to reach the support level once again.
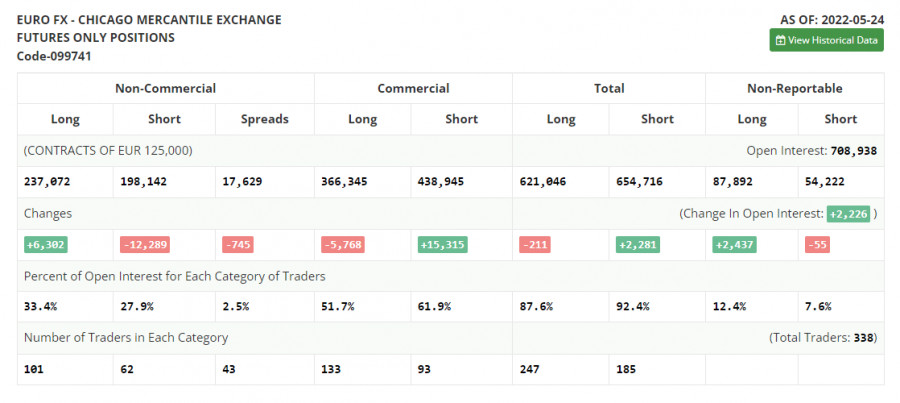
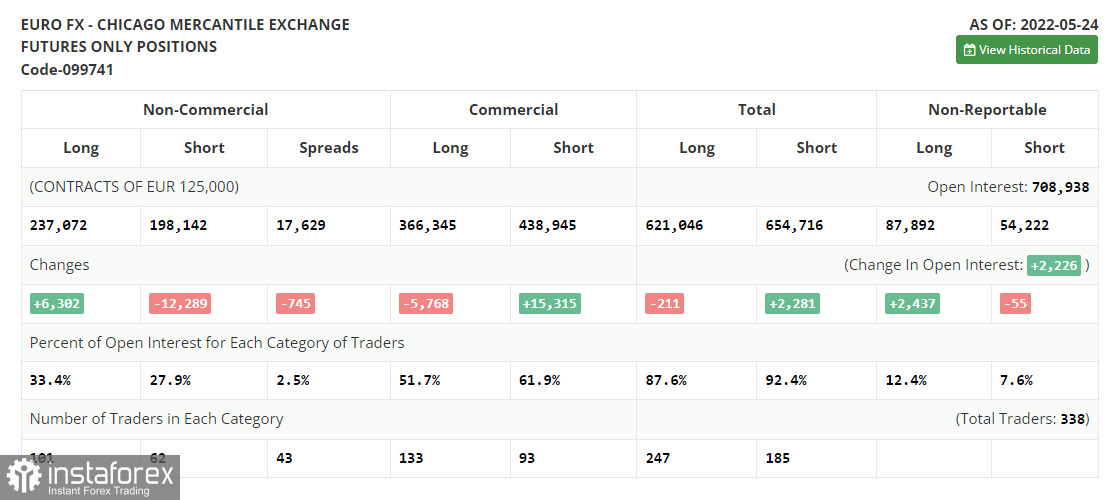
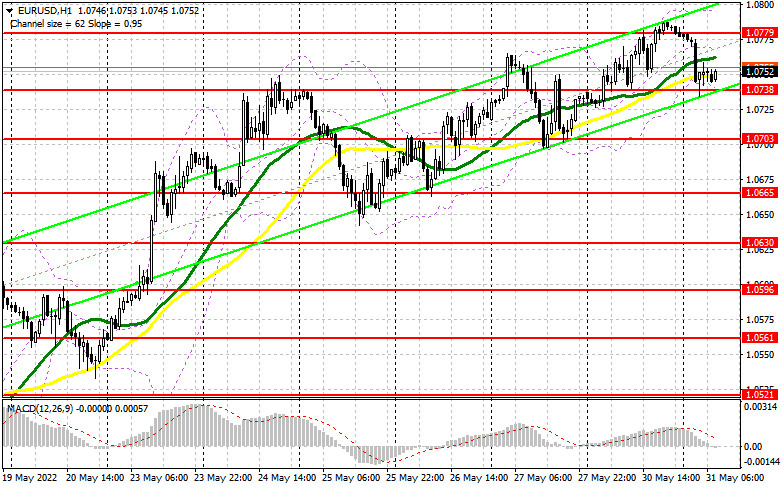
Before we start analyzing the future movement of the euro/dollar pair, let's see what is happening on the futures market and look through the new COT report. According to the COT report from May 24, the number of long positions advanced, whereas the number of short positions dropped. Traders continued opening long positions, expecting a more aggressive monetary policy from the ECB. Although last week, there were less comments about a key interest rate hike in the near future, the euro/dollar pair managed to retain its upward potential. Now, analysts suppose that the ECB will raise the deposit rate by one-fourth of a basis point as early as July. The next two hikes will take place in September and December. By the end of the year, the benchmark rate is expected to be at the level of 0.25%. However, some experts are sure that the central bank will have to take more aggressive measures. A lot depends on the inflation report for May of this year. The indicator may jump to 7.7% on a yearly basis, thus increasing pressure on politicians. Against the backdrop, the regulator may raise the key interest rate up to 0.5% from the current zero level. The COT report unveiled that the number of long non-commercial positions increased by 6,302 to 237,072 from 230,770, while the number of short non-commercial positions declined by 12,289 to 198,142 from 210,431. The euro's low price is making the currency more attractive for mid-term traders. According to the weekly results, the total non-commercial net position increased to 38,930 from 20,339. The weekly close price jumped to 1.0734 from 1.0556.
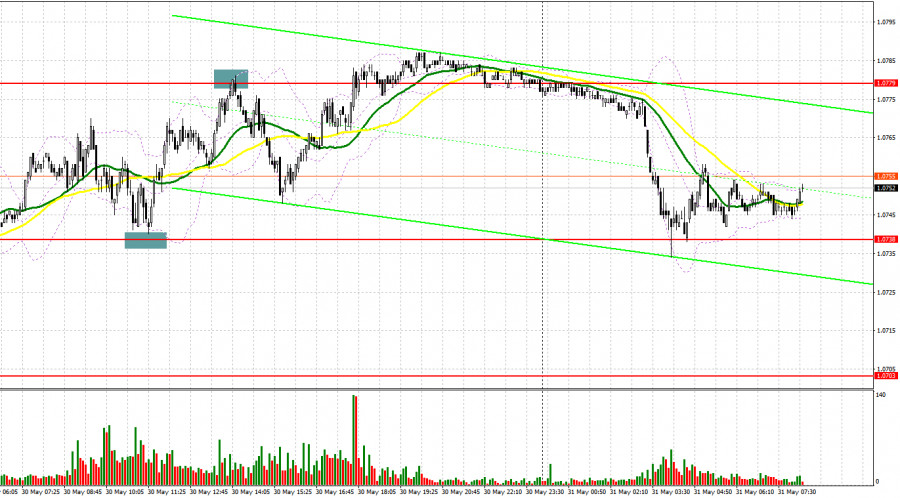
Today, the technical picture was almost the same as yesterday. That is why traders may use the same strategy. However, today, the eurozone is going to disclose a bulk of macroeconomic reports. Thus, France's CPI report and Germany's unemployment change data and unemployment rate report will hardly be of primary importance. However, the eurozone CPI figures for May are likely to affect the market situation. It will be better to go long from the intermediate support level of 1.0738, which was already hit during the Asian trade. That is why only a false break of this level as well as a surge in eurozone inflation will give a buy signal with the target at 1.0779. A break and a downward test of this level will give a new buy signal, allowing the pair to recover to 1.0811.Today, the euro will hardly hit the level of 1.0844 due to the fact that traders may start closing positions on the last day of the month. If the euro drops and buyers fail to protect 1.0738, pressure on the euro may surge. Bulls may start to lock in profits, expecting a considerable decline. In this case, traders should be very cautious when opening long orders. It will be wise to wait for a false break of 1.0703. It is also possible to go long after a bounce off 1.0665 or lower – off 1.0630, expecting a rise of 30-35 pips a day.
Conditions for opening short positions on EUR/USD:
Bears managed to protect all the necessary levels and pushed the price to its new monthly lows. However, to return pressure on the euro, bears should take control over 1.0738. They may do this today amid weak data from the eurozone and less rapid inflation growth. If the euro surges once again, traders should focus on the resistance level of 1.0779. Only a false break of this level will give a sell signal with the target at the support level of 1.0738. A break and settlement below this level as well as an upward test will give a sell signal, which may affect buyers' stop orders and push the price to 1.0703. Slightly below 1.0738, there are moving averages. That is why a break of this area will have a significant influence on the future trend. A farther target is located at 1.0665, where it is recommended to lock in profits. However, the pair may hit this level only in the second part of the day. If the euro climbs and bears fail to protect 1.0779, the uptrend will continue, allowing the pair to reach new highs. Against the backdrop, it will be better to open short orders after a false break of 1.0811. It is also possible to sell the asset after a rebound from 1.0844 or higher – from 1.0894, expecting a drop of 30-35 pips..
Signals of indicators:
Moving Averages
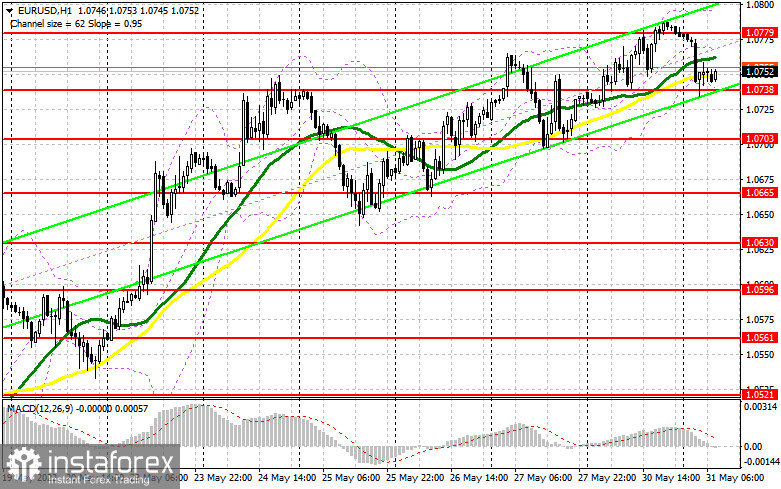
Trading is performed slightly above 30- and 50-day moving averages, thus reflecting the uptrend.
Note: The period and prices of moving averages are considered by the author on the one-hour chart that differs from the general definition of the classic daily moving averages on the daily chart.
Bollinger Bands
A break of the lower limit of the indicator located at 1.0738 may cause a decline in the euro. A break of the upper limit of the ranges located at 1.0800 may boost the single currency.
Description of indicators
- Moving average (moving average, determines the current trend by smoothing volatility and noise). The period is 50. It is marked in yellow on the chart.
- Moving average (moving average, determines the current trend by smoothing volatility and noise). The period is 30. It is marked in green on the graph.
- MACD indicator (Moving Average Convergence/Divergence - convergence/divergence of moving averages). A fast EMA period is 12. A slow EMA period is 26. The SMA period is 9.
- Bollinger Bands. The period is 20.
- Non-profit speculative traders are individual traders, hedge funds, and large institutions that use the futures market for speculative purposes and meet certain requirements.
- Long non-commercial positions is a total number of long positions opened by non-commercial traders.
- Short non-commercial positions is a total number of short positions opened by non-commercial traders.
- The total non-commercial net position is a difference in the number of short and long positions opened by non-commercial traders.