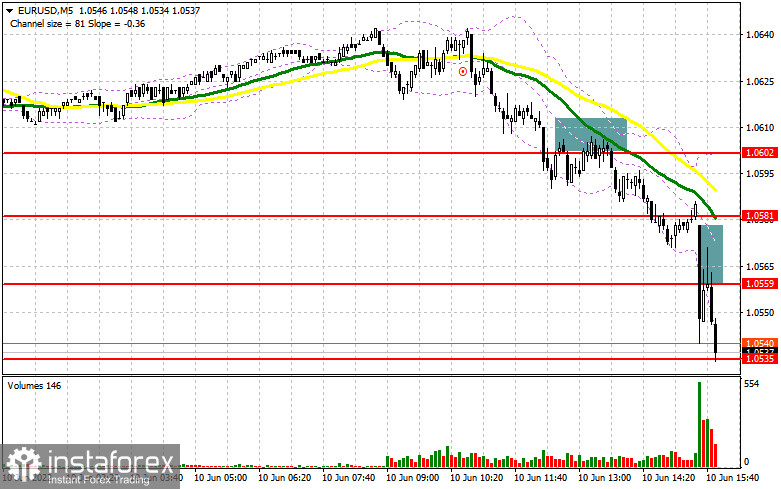
In the morning article, I highlighted several levels and recommended taking decisions with those levels in focus. Now let's look at the 5-minute chart and try to figure out what actually happened. A drop below 1.0602 and an upward test of this level gave an excellent sell signal within the trend that appeared after the ECB meeting. It triggered a sharp downward movement even before the release of inflation data. The pair declined by 40 pips. Traders were hardly surprised by a decrease in the euro after the inflation report. which I have repeatedly mentioned such a possibility. The pair slid by 30 pips amid a breakout, an upward test of 1.0559, and a sell signal. At the time of writing the article, that signal had already led to a breakout of 1.0535.
What is needed to open long positions on EUR/USD
Bulls lost the upper hand after inflation in the United States soared in May, reaching another record level. Contrary to the expectations of the Federal Reserve System, which assumed that inflation had achieved its peak in April, the figure did not decline. Now, the central bank needs to act more aggressively. It is quite difficult to predict what will happen next. Oil prices are firmly above $100 per barrel for a long time. Prices are also surging for various categories of goods and services. Although Janet Yellen believes that a recession in the US economy looks unlikely, the figures show the opposite. The main task of the bulls is to protect the support level of 1.0535. A false breakout of this level may lead to a slight upward correction of the euro to 1.0559 and even to 1.0585 where I recommend locking in profits. It is better to open long positions from 1.0585 only after a breakout and a downward test of this level, which will bring new buying opportunities. So, the pair could even reach 1.0617. If EUR /USD continues to decrease, it is recommended to buy only after a false breakout of 1.0499. If bulls show no energy at this level, traders will rush to close stop-loss orders, pushing the pair to 1.0462. At this level, you may also open long positions. You can buy EUR/USD immediately at a bounce from the level of 1.0423 or even a low of 1.0391 with an upward intraday correction of 30-35 pips.
What is needed to open short positions on EUR/USD
Sellers continue to push the pair lower. I think the downward movement will continue and I would not advise counting on a strong upward correction at the end of the week. If EUR/USD rises sharply in the afternoon, only a false breakout of 1.0559 will generate a sell signal with the prospect of a return to 1.0535. Given that trading is carried out below the moving averages, especially after such negative news, bulls will definitely be unable to regain the upper hand in the short term. A decline below 1.0535, as well as an upward test of this level, will give an additional sell signal. In this case, EUR bulls will close stop-loss orders. The pair is likely to slump to 1.0499 or to 1.0499. In this case, a more distant target will be the 1.0462 level where I recommend closing all short positions. If EUR/USD climbs during the American session and bears show no energy at 1.0559, a correction may occur. It is better to open short positions after a false breakout of 1.0585. You can sell EUR/USD immediately at a bounce from a high of 1.0617 or even 1.0657, keeping in mind a downward intraday correction of 30-35 pips.
COT report
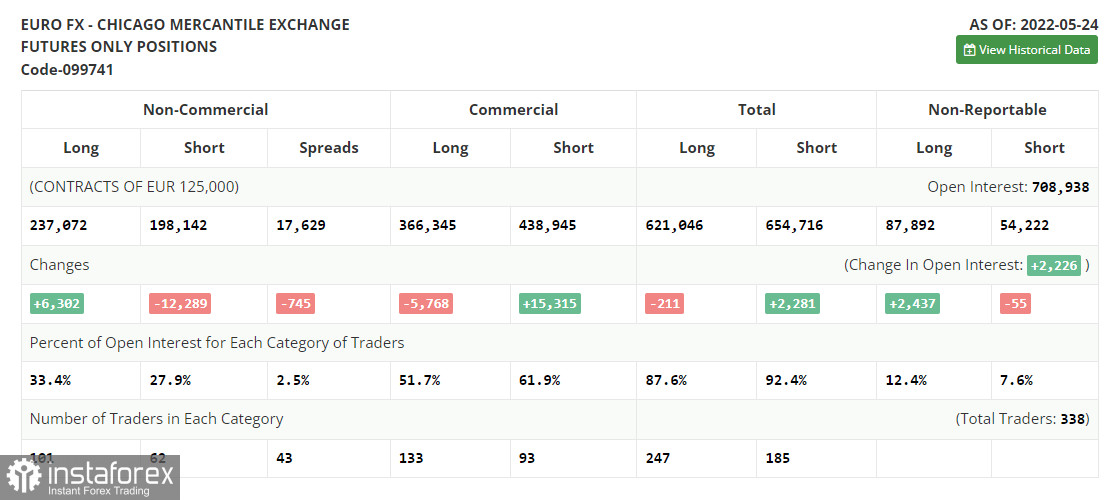
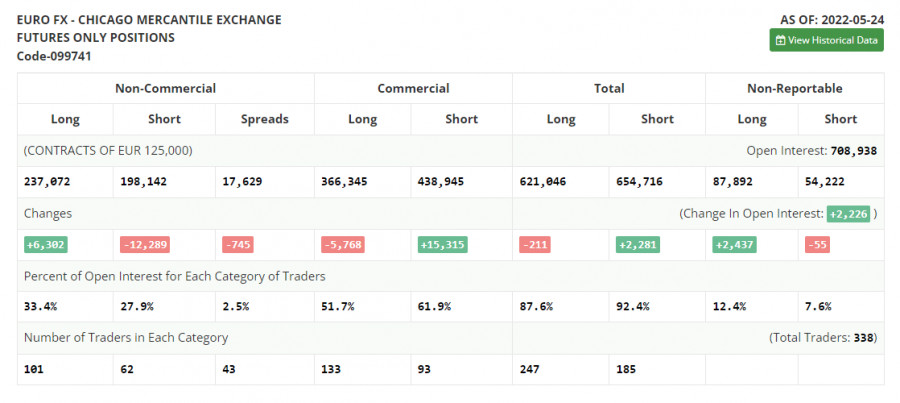
The COT report for May 24 logged a rise in the number of long positions and a decline in the number of short positions. Traders continued opening long positions, expecting a more aggressive monetary policy from the ECB. Although last week, there were fewer comments about a key interest rate hike in the near future, the euro/dollar pair managed to retain its upward potential. Now, analysts suppose that the ECB will raise the deposit rate by one-fourth of a basis point as early as July. The next two hikes will take place in September and December. By the end of the year, the benchmark rate is expected to be at the level of 0.25%. However, some experts are sure that the central bank will have to take more aggressive measures. A lot depends on the inflation report for May of this year. The indicator may jump to 7.7% on a yearly basis, thus increasing pressure on politicians. Against the backdrop, the regulator may raise the key interest rate up to 0.5% from the current zero level. The COT report unveiled that the number of long non-commercial positions increased by 6,302 to 237,072 from 230,770, while the number of short non-commercial positions declined by 12,289 to 198,142 from 210,431. The euro's low price is making the currency more attractive for mid-term traders. According to the weekly results, the total non-commercial net position increased to 38,930 from 20,339. The weekly close price jumped to 1.0734 from 1.0556.
Signals of technical indicators
Moving averages
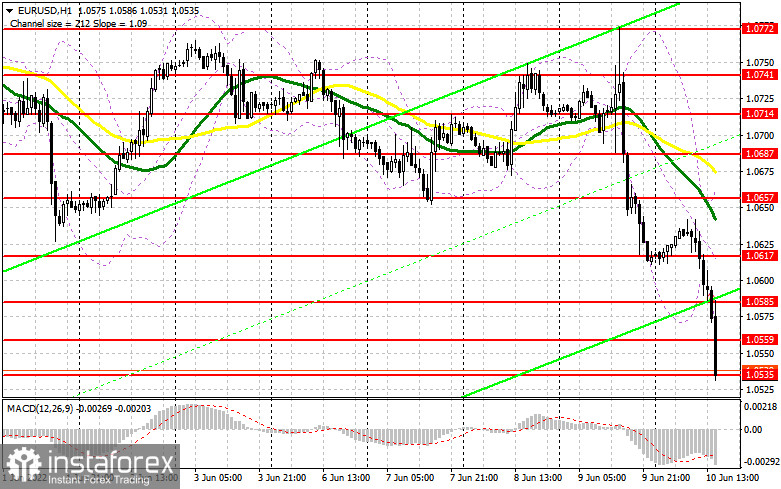
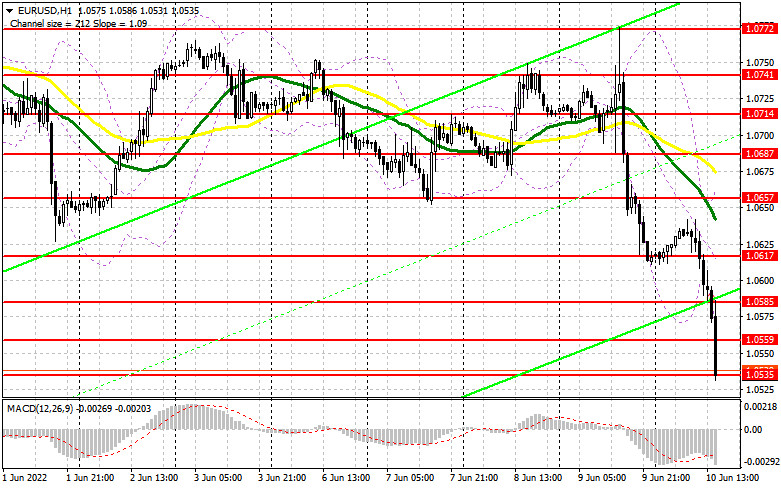
EUR/USD is trading below 30- and 50-period moving averages, indicating the resumption of a bearish trend.
Remark. The author is analyzing the period and prices of moving averages on the 1-hour chart. So, it differs from the common definition of classic daily moving averages on the daily chart.
Bollinger Bands
In case of a rise, the upper border at 1.0657 will act as resistance.
Definitions of technical indicators
- Moving average recognizes an ongoing trend through leveling out volatility and market noise. A 50-period moving average is plotted yellow on the chart.
- Moving average identifies an ongoing trend through leveling out volatility and market noise. A 30-period moving average is displayed as the green line.
- MACD indicator represents a relationship between two moving averages that is a ratio of Moving Average Convergence/Divergence. The MACD is calculated by subtracting the 26-period Exponential Moving Average (EMA) from the 12-period EMA. A 9-day EMA of the MACD called the "signal line".
- Bollinger Bands is a momentum indicator. The upper and lower bands are typically 2 standard deviations +/- from a 20-day simple moving average.
- Non-commercial traders - speculators such as retail traders, hedge funds, and large institutions who use the futures market for speculative purposes and meet certain requirements.
- Non-commercial long positions represent the total long open position of non-commercial traders.
- Non-commercial short positions represent the total short open position of non-commercial traders.
- The overall non-commercial net position balance is the difference between short and long positions of non-commercial traders.