The euro has notably recovered after a big sell-off in the Asian trade caused by an overall turmoil in financial markets. In my morning review, I mentioned the level of 0.9655 and recommended entering the market from there. Let's analyze what happened on the 5-minute chart. Bears managed to defend this range on the first try by forming a false breakout and a sell signal. After that, the pair went down by 20 pips. Yet, no deeper decline followed. At the second attempt, the price broke above 0.9655 and rose to 0.9707. I couldn't open any short positions from there as the quote missed just a few pips to reach this range. The technical setup has slightly changed for the second half of the session.
For long positions on EUR/USD:
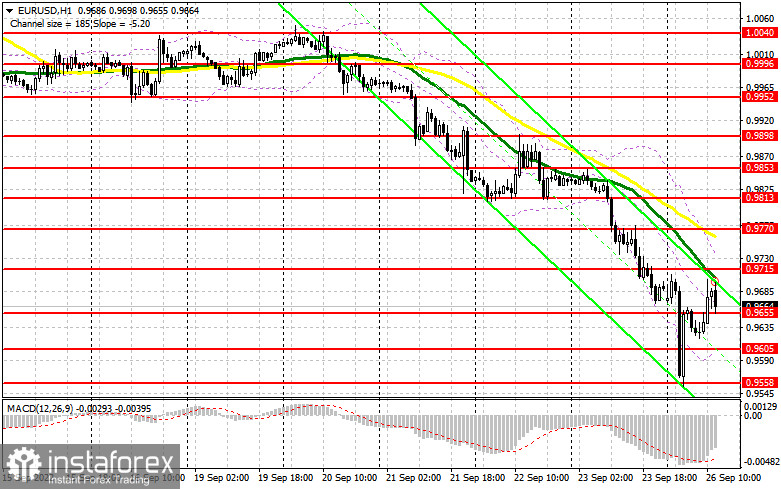
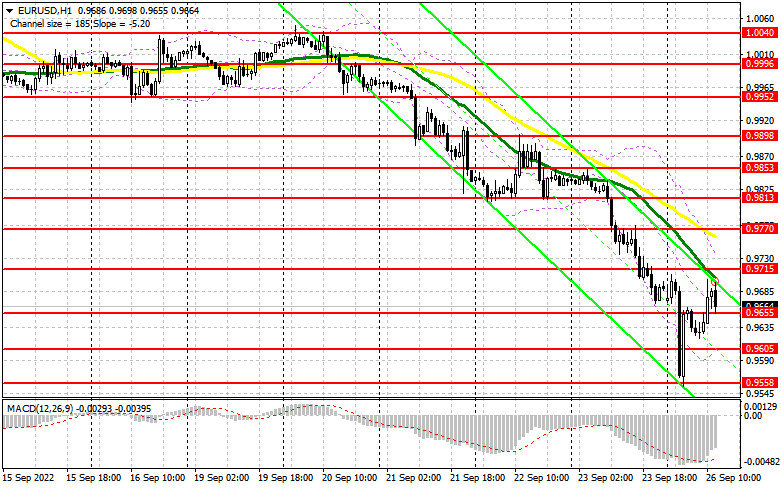
I would recommend that buyers pay attention to the nearest support level of 0.9655 which served as resistance early this morning. In the North American session, traders will take notice of comments made by FOMC members. However, I doubt that Raphael Bostic, Loretta Mester, and Susan M. Collins could somehow influence the demand for risk assets. Therefore, the pair is likely to come under more pressure again. The best way to open long positions against the trend is to wait for a false breakout near the support of 0.9655. This will create a good entry point, considering a recovery towards the level of 0.9715 that was formed last Friday. A hold above this range and its downward retest will offset the efforts of the sellers to control the area below 0.9600. This will generate a buy signal and a recovery of the price towards 0.9770 where the moving averages play on the side of bears. The level of 0.9813 will serve as the upper target where I recommend profit taking. If EUR/USD declines after hawkish comments made by the Fed's officials, and bears return to the market to 0.9655, the pair will quickly slide to 0.9605. You can buy at this level but only after a false breakout. Long positions can be opened right after a rebound only from the yearly low of 0.9558 or 0.9509. Keep in mind an intraday upside correction of 30-35 pips.
For short positions on EUR/USD:
Bulls performed a strong counterattack in the Asian session when large market players seized the moment and stopped the decline of the pair, thus bringing balance to the market. The best scenario for going short on the pair will be a false breakout near the resistance area of 0.9715. This will form a sell signal towards the lower target at 0.9655 where the fight may intensify. This level serves as a benchmark for both buyers and sellers. A breakout and consolidation below 0.9655 will resume the downward pressure on the euro. An upward retest similar to the one I discussed above will create an additional sell signal which will trigger stop-loss orders set by the bulls and push the price to the low of 0.9605. The support at 0.9558 will act as a more distant target where I recommend profit taking. If EUR/USD moves up in the US session, and bears are idle at 0.9715, the market will get into a panic and start a massive upside correction. If so, it is better to wait until the price hits the level of 0.9770. Its false breakout will form a good entry point for opening short positions. Selling EUR/USD is possible right after a rebound from the high of 0.9813 or 0.9853, bearing in mind a downside correction of 30–35 pips.
COT report:
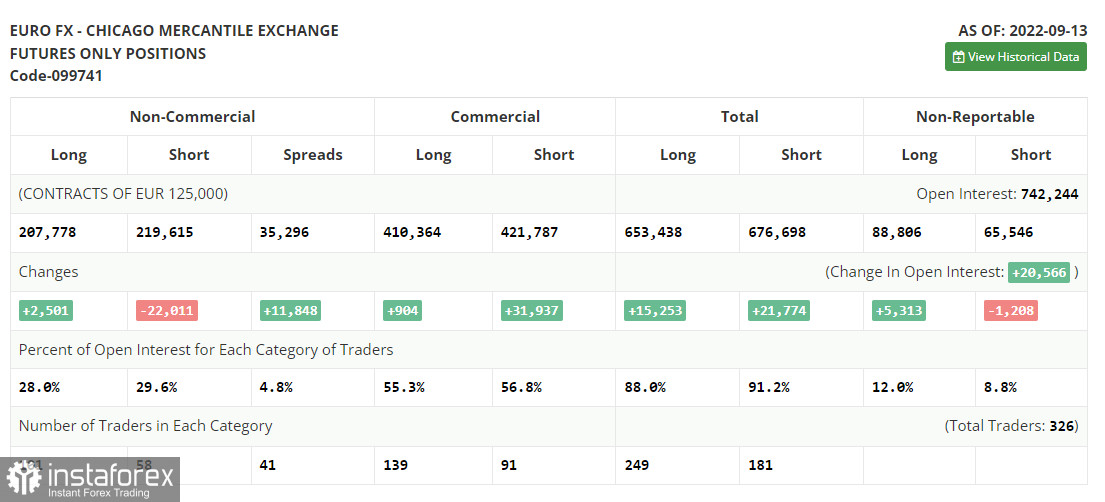
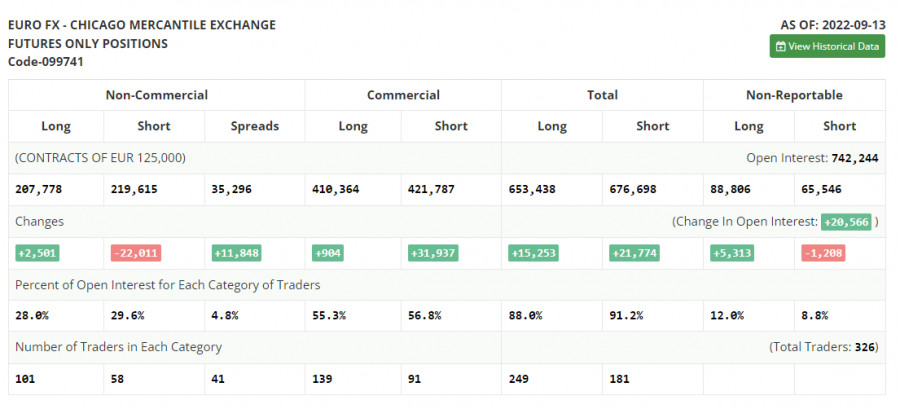
The Commitment of Traders report for September 13 recorded a drop in the short positions and a slight increase in the long ones. This means that the ECB meeting and a rate hike of 0.75% have influenced the market sentiment. Traders preferred to take profit at the current levels even despite the upcoming Fed meeting. The FOMC has raised the rate by another 0.75% this week. So, the speculations that the regulator would hike the rate by a full percentage point turned out to be false. Anyway, another rate hike will definitely support the US dollar and lead to a rapid fall in the European currency. Given the recent inflation data for August, the Fed will continue to tighten its policy. At the same time, the European Central bank is no longer idle. The gap between the ECB's and the Fed's rate policies is gradually narrowing. This is a good factor for long-term investors in the euro who hope that demand for risk assets will soon recover. According to the COT report, long positions of the non-commercial group of traders went up by 2,501 to 207,778, while short positions decreased by 22,011 to 219,615. Last week, the net non-commercial position remained negative but rose slightly to -11,832 from -36,349, indicating the continuation of an upside correction and the fact that the pair has almost hit the bottom. The weekly closing price increased to 0.9980 from 0.9917.
Indicator signals:
Moving Averages
Trading below the 30- and 50-day moving averages indicates a further decline in the euro.
Please note that the time period and levels of the moving averages are analyzed only for the H1 chart, which differs from the general definition of the classic daily moving averages on the D1 chart.
Bollinger Bands
In case of an upward movement, the upper band of the indicator at 0.9720 will serve as resistance.
Description of indicators:
• A moving average of a 50-day period determines the current trend by smoothing volatility and noise; marked in yellow on the chart;
• A moving average of a 30-day period determines the current trend by smoothing volatility and noise; marked in green on the chart;
• MACD Indicator (Moving Average Convergence/Divergence) Fast EMA with a 12-day period; Slow EMA with a 26-day period. SMA with a 9-day period;
• Bollinger Bands: 20-day period;
• Non-commercial traders are speculators such as individual traders, hedge funds, and large institutions who use the futures market for speculative purposes and meet certain requirements;
• Long non-commercial positions represent the total number of long positions opened by non-commercial traders;
• Short non-commercial positions represent the total number of short positions opened by non-commercial traders;
• The non-commercial net position is the difference between short and long positions of non-commercial traders.