Analyzing Wednesday's trades:
EUR/USD on 30M chart
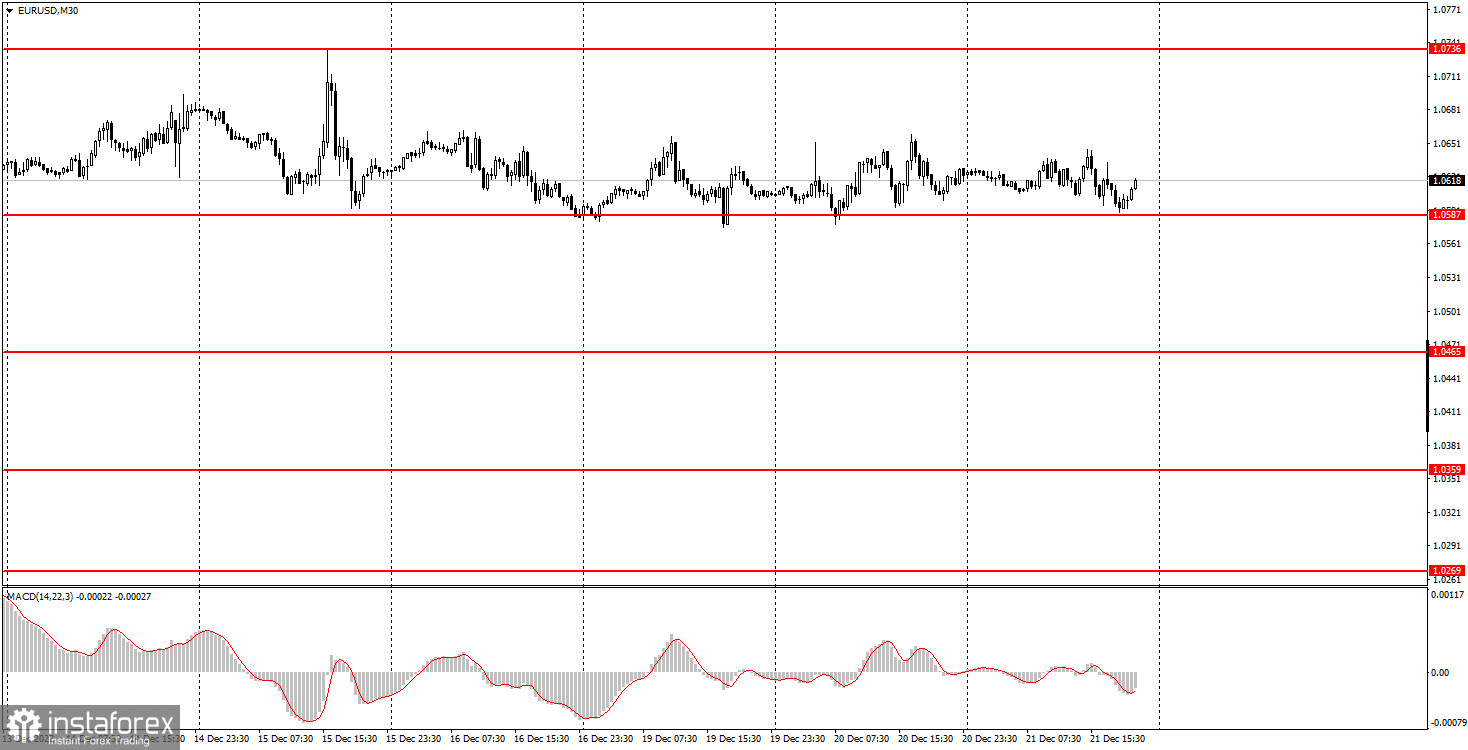
EUR/USD was still trading sideways on Wednesday. I have already warned you that this is the most likely scenario. As you can see, so far the pair is in absolute flat, which is perfectly visible in the chart above. It is hardly worth saying that there were no important reports or events in the EU and the US on Wednesday. It is hardly necessary to form a separate horizontal channel for the flat guidelines. Thus, the pair remains near its local highs and cannot correct normally. As I have already mentioned, we can see this kind of movement at least until the New Year, and possibly even longer. There have been cases when the flat lasted for several months. Moreover, on the 24-hour chart, the pair was in a downtrend for about 2 years, then it had a bullish correction, so now a prolonged flat may well begin. We need to be ready for this. I don't think that the remaining reports this week are able to move the price.
EUR/USD on M5 chart
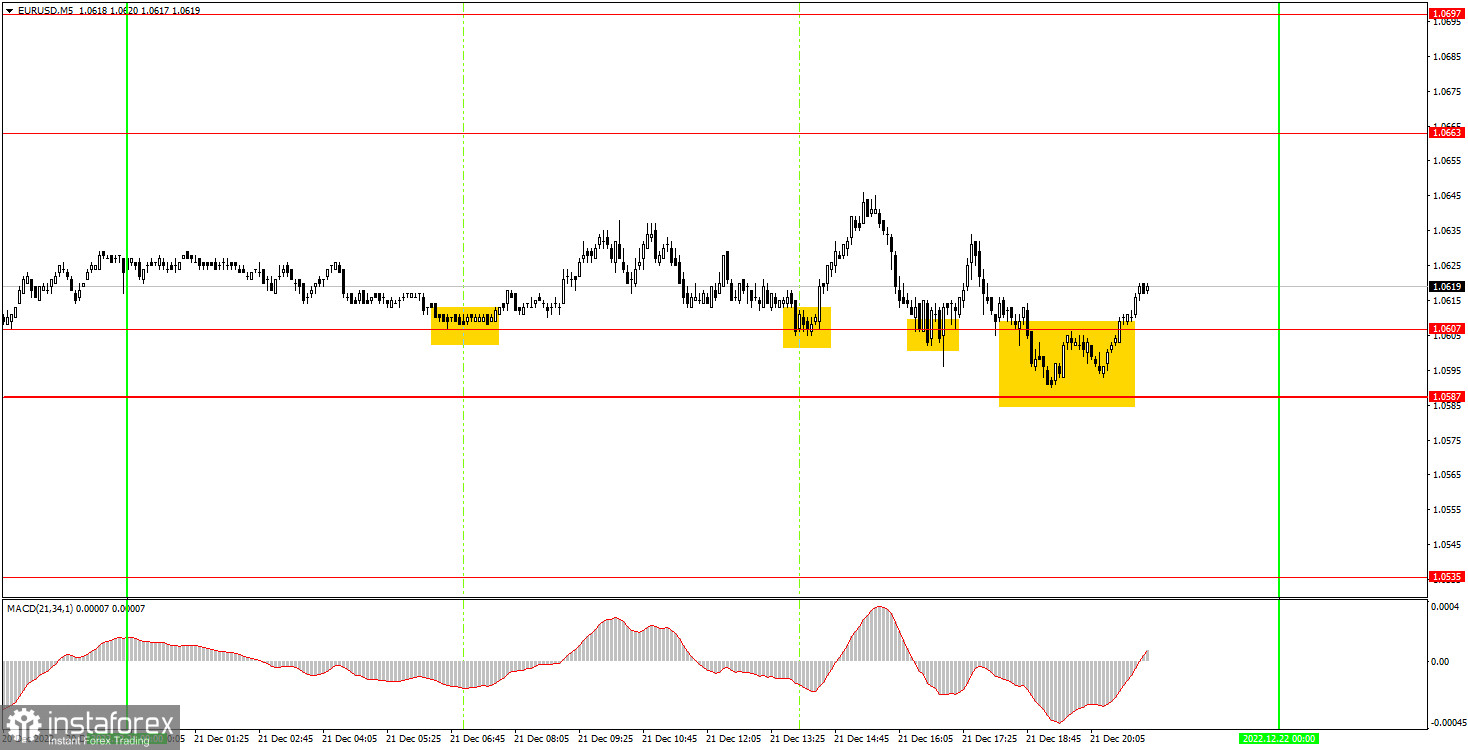
Speaking of trading signals, it's safe to say that novice traders were lucky again. The price bounced from 1.0607 thrice and once from the area of 1.0587-1.0607. Since EUR never reached the target level of 1.0663, all four signals are deemed false. And novice traders could try to work out the first two of them. In both cases, the pair went up the required 15 points, so in both cases, Stop Loss should have been set to breakeven. Consequently, there was no loss, which is a good result for a day when there was not only a flat, but also very low volatility – only about 50 points.
Trading tips on Thursday:
On the 30-minute chart, the pair is still in the 1.0587-1.0736 horizontal channel. Thus, in order to count on at least some kind of trend, it is necessary for the pair to leave this range. The direction will be determined by which limit the pair decides to cross. So far, there are more chances of crossing the lower limit of the channel. On the 5-minutes chart on Thursday, it is recommended to trade on the levels 1.0465-1.0483, 1.0536, 1.0587-1.0607, 1.0663, 1.0697, 1.0736, 1.0787, 1.0806. As soon as the price passes 15 pips in the right direction, you should set a Stop Loss to breakeven. On Thursday, no important events are planned in the European Union again, and secondary reports on applications for unemployment benefits and GDP for the third quarter will be released in the United States. Thus, there is every reason to assume that the flat will persist.
Basic rules of the trading system:
1) The strength of the signal is determined by the time it took the signal to form (a rebound or a breakout of the level). The quicker it is formed, the stronger the signal is.
2) If two or more positions were opened near a certain level based on a false signal (which did not trigger a Take Profit or test the nearest target level), then all subsequent signals at this level should be ignored.
3) When trading flat, a pair can form multiple false signals or not form them at all. In any case, it is better to stop trading at the first sign of a flat movement.
4) Trades should be opened in the period between the start of the European session and the middle of the US trading hours when all positions must be closed manually.
5) You can trade using signals from the MACD indicator on the 30-minute time frame only amid strong volatility and a clear trend that should be confirmed by a trendline or a trend channel.
6) If two levels are located too close to each other (from 5 to 15 pips), they should be considered support and resistance levels.
On the chart:
Support and Resistance levels are the levels that serve as targets when buying or selling the pair. You can place Take Profit near these levels.
Red lines are channels or trend lines that display the current trend and show in which direction it is better to trade now.
The MACD indicator (14, 22, and 3) consists of a histogram and a signal line. When they cross, this is a signal to enter the market. It is recommended to use this indicator in combination with trend patterns (channels and trendlines).
Important announcements and economic reports that can be found on the economic calendar can seriously influence the trajectory of a currency pair. Therefore, at the time of their release, we recommend trading as carefully as possible or exiting the market in order to avoid sharp price fluctuations.
Beginners on Forex should remember that not every single trade has to be profitable. The development of a clear strategy and money management is the key to success in trading over a long period of time.