empty
 
 
01.02.2023 10:30 AM
EUR/USD and GBP/USD technical analysis on February 1, 2023

EUR/USD

This image is no longer relevant

Higher time frames

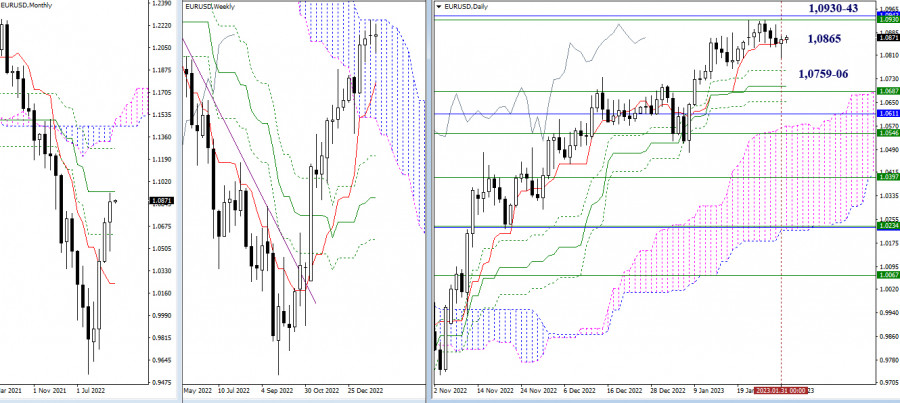
Bears were quickly exhausted yesterday. By the end of the day, the pair returned to the resistance zone of the daily short-term trend at 1.0865. Notably, the pair closed last month with a bullish candlestick which does not have any importance. In January, EUR/USD tested the resistance of the monthly medium-term trend at 1.0943 which coincides with the upper boundary of the weekly Ichimoku Cloud at 1.0930. Yet, the price failed to rebound or break through this range. Probably in February, the movements of the pair will be more pronounced. Key targets for today remain the same. The resistance area is found at 1.0943-30, while the support zone is located at 1.0759 – 1.0706 – 1.0687 (daily cross + weekly short-term trend). The level of the daily short-term trend at 1.0865 serves as the main target today.

This image is no longer relevant

H4 – H1

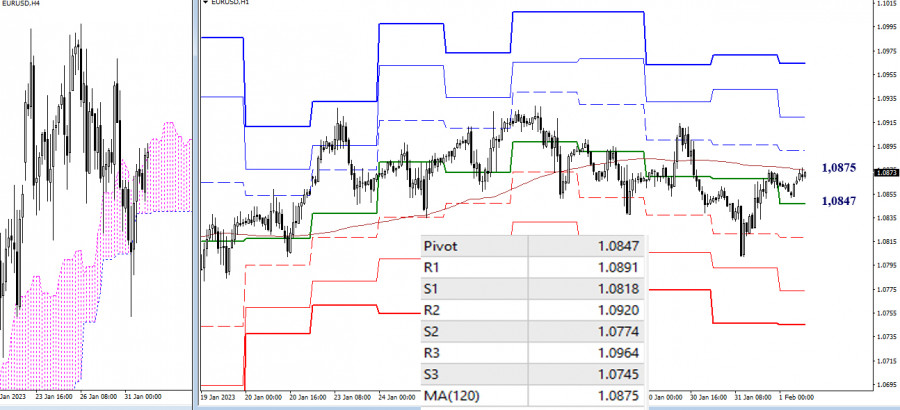
On lower time frames, bearish activity was low and not productive. The pair returned to the key resistance zone of the weekly long-term trend at 1.0875. Gaining control of this range ensures the prevalence on lower time frames. Trading near this level indicates market uncertainty. If bulls develop any activity today, their main intraday targets will be 1.0891 – 1.0920 – 1.0964 (resistance of standard pivot levels). Bears will be working towards the support of standard pivot levels at 1.0847 – 1.0818 – 1.0774 – 1.0745.

***

GBP/USD

This image is no longer relevant

Higher time frames

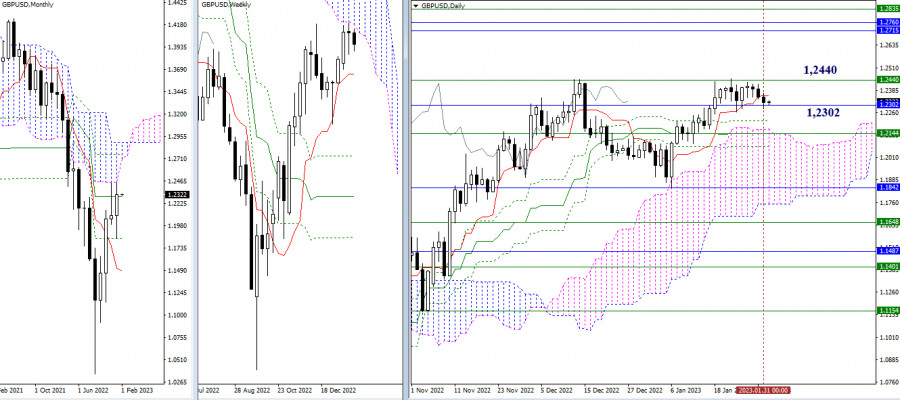
The pound/dollar pair closed last month without any significant changes. The price is still holding in the previous channel between 1.2302 (monthly medium-term trend) and 1.2440 (lower boundary of the weekly Ichimoku Cloud). Exiting this price range will allow the pair to choose a new direction. The nearest support zone is located at 1.2215 – 1.2144 – 1.2072 (daily cross + daily cloud + weekly short-term trend). The resistance area is formed by 1.2715 – 1.2760 – 1.2835 (boundaries of monthly and weekly clouds + monthly Fibo Kijun level).

This image is no longer relevant

H4 – H1

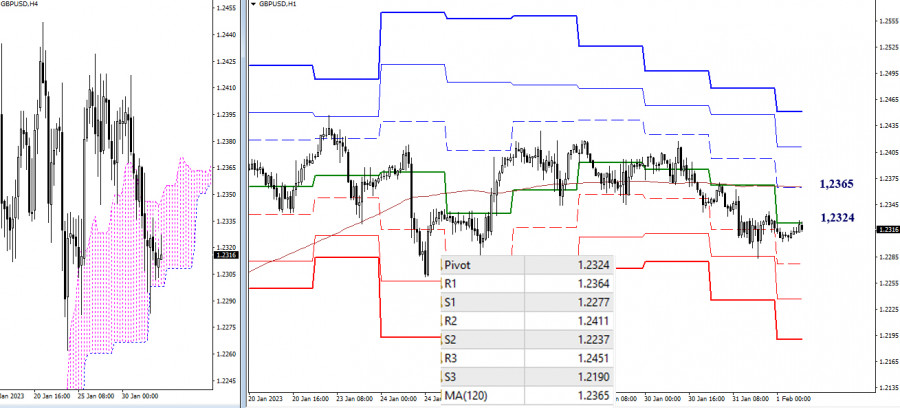
Currently, bears are in control of the market on lower time frames. A retest of yesterday's low of 1.2283 will allow the sellers to push the price lower to the support of standard pivot levels at 1.2277 – 1.2237 – 1.2190. If the pair develops an upside correction instead, the buyers will need to gain control of the key levels of 1.2324 – 1.2365 (central pivot level + weekly long-term trend) to take the lead in the market. Their next upward targets are seen at 1.2411 and 1.2451 (resistance of pivot levels).

***

Technical analysis is based on:

Higher time frames – Ichimoku Kinko Hyo (9.26.52) + Fibo Kijun levels

Lower time frames – H1: Pivot Points (standard) + 120-day Moving Average (weekly long-term trend)

Dapatkan keuntungan dari perubahan nilai mata uang kripto dengan InstaForex.
Unduh MetaTrader 4 dan buka perdagangan pertama Anda.
  • Grand Choice
    Contest by
    InstaForex
    InstaForex always strives to help you
    fulfill your biggest dreams.
    GABUNG KONTES
  • Chancy Deposit
    Isi akun Anda sebesar $3000 dan dapatkan $9000 lebih banyak!
    Pada Mei kami mengundi $9000 dalam promo Chancy Deposit!
    Dapatkan kesempatan untuk menang dengan melakukan deposit sebesar $3000 pada akun trading Anda. Setelah memenuhi persyaratan ini, Anda telah menjadi partisipan promo.
    GABUNG KONTES
  • Trade Wise, Win Device
    Top up akun anda dengan dana minimal $500, daftar kontes, dan dapatkan peluang untuk memenangkan perangkat seluler.
    GABUNG KONTES
  • 100% Bonus
    Kesempatan langka untuk mendapatkan bonus 100% pada deposit anda
    DAPATKAN BONUS
  • 55% Bonus
    Ajukan bonus 55% pada setiap deposit anda
    DAPATKAN BONUS
  • 30% Bonus
    Raih bonus 30% setiap kali anda top up
    DAPATKAN BONUS

Artikel yang direkomendasikan

Tidak bisa bicara sekarang?
Tanyakan pertanyaan anda lewat chat.
Widget callback