From the point of view of a comprehensive analysis, you can see low activity, which focuses on itself the special attention of market participants, and now let's talk about the details. The last trading day was one of the lowest since the beginning of the year, where the quote literally stood in one place, having a narrow range of 39 points. The reason for such a low activity lies in a number of factors; first of all, it is worth considering the lack of trading volumes due to a day off in the United States and Great Britain, as well as a distinct accumulation, which should be analyzed in more detail. So, note that a sharp decline in activity occurred after the quote in the inertial phase moved to the area of interaction of the trading forces 1.2240 / 1.2280, where the sluggish recovery process began. That is, the market managed to rebound by only 100 points in four trading days, while the average daily dynamics was 60 points, which, taking into account the average rate for the pound sterling [130 points], is considered a very small value. It turns out that the market was not ready for a return, otherwise the dynamics and price movement would be sharper. At this stage, an accumulation process arises, where there are no large trading volumes, and traders try not to enter the market without a sharp need. The accumulation process leads to increased interest among market participants, and if it is delayed, then first of all there are speculators who begin to work on small volumes and often lead the market to even greater error.
When analyzing the past trading day in detail, it is worth highlighting the framework of stagnation of 1.2160/1.2200, which became the narrowest in the entire accumulation process.
As discussed in the previous review, the main trend for traders was the global trend, but at the same time, there were local operations that considered the breakdown of the boundaries of the established slowdown.
Considering the trading chart in general terms [the daily period], one should not forget that a downward tact of May 1 came to the market after a long flat formation, in the structure of which current price fluctuations occur.
The news background of the past day did not have statistics on Britain and the United States, but, as previously written, there was an official holiday in these countries.
The market reaction to statistics was not in favor of the pound sterling.
In terms of the general informational background, it cannot be said that there was some surge in activity in the media. From an analysis of the external background, it can be said that there has been a characteristic lull on all fronts since the weekend, perhaps a strange pause has been taken.
In turn, interesting news still appeared from the informational silence, and so, the Prime Minister's Office Boris Jonsan reports that quarantine measures in the country will soon be softened. This statement refers to the retail opening schedule, presumably from June 15, unless, of course, the situation in the country worsens in the allotted time. At the same time, restrictions will be lifted from the open market and car dealerships on June 1 in England.
Today, in terms of the economic calendar, we only have data on the real estate market in the United States. So, the composite housing cost index S & P / CS Composite-20 expects a decline from 3.5% to 3.0%, while the sale of new homes is reduced by -21.1%. Based on statistical indicators, we can say that the dollar will be under pressure again, if the fundamental analysis works.
Further development
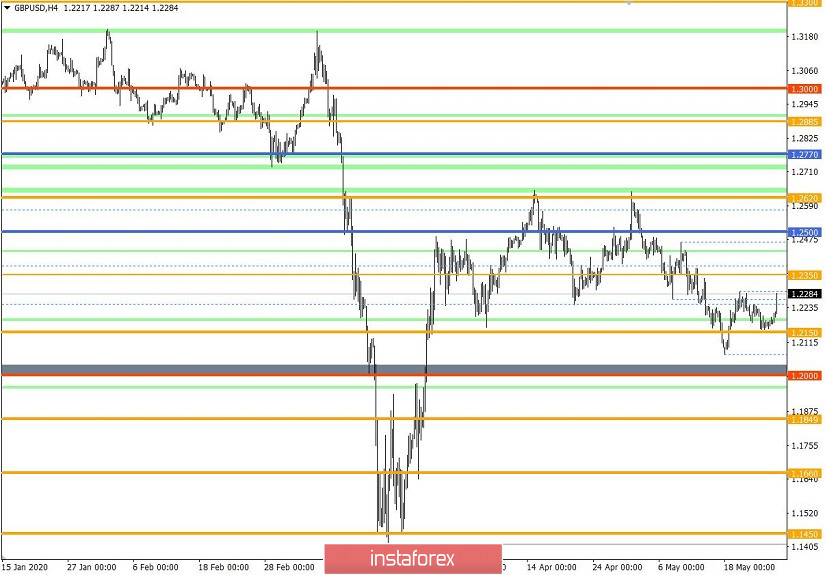
Analyzing the current trading chart, we can see a sharp surge in activity, where the past accumulation played the role of a kind of catalyst for trading forces. It is worth highlighting the framework for the fluctuations of the past day at 1.2160/1.2200, which was what speculators focused on when laying down trading operations. The existing surge in long positions led the quote back to the area of interaction of the trading forces 1.2240 / 1.2280, with which it all started in the period earlier.
It can be assumed that the area of 1.2240 / 1.2280 will continue to exert pressure on market participants, where speculators will take advantage of the situation to take profits, eventually having a slowdown with a new rebound. At the same time, it is worth considering an alternative scenario in which the area of interaction of trade forces falls, in this case, the dynamics of fluctuations will return to the framework of the previously broken flat of 1.2150 // 1.2350 // 1.2650.
Based on the above information, we derive trading recommendations:
- Selling positions are considered below 1.2250, with the prospect of a movement to the 1.2150 / 1.2180 area.
- Buying positions have already taken place in terms of local operations above the level of 1.2200. Now it's worth leaving the transaction to even out the risks and if prices are consolidated higher than 1.2310, they will return to their positions in case the quote returns to sideways movement again.
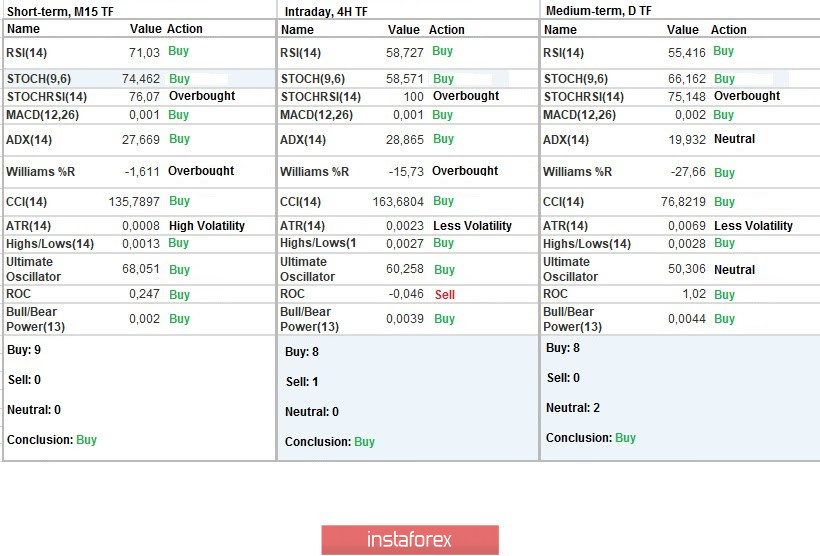
Indicator analysis
Analyzing a different sector of time frames (TF), we see that the indicators of technical instruments on hourly and daily periods indicate an upward interest due to the return of prices to the area of interaction of trade forces.
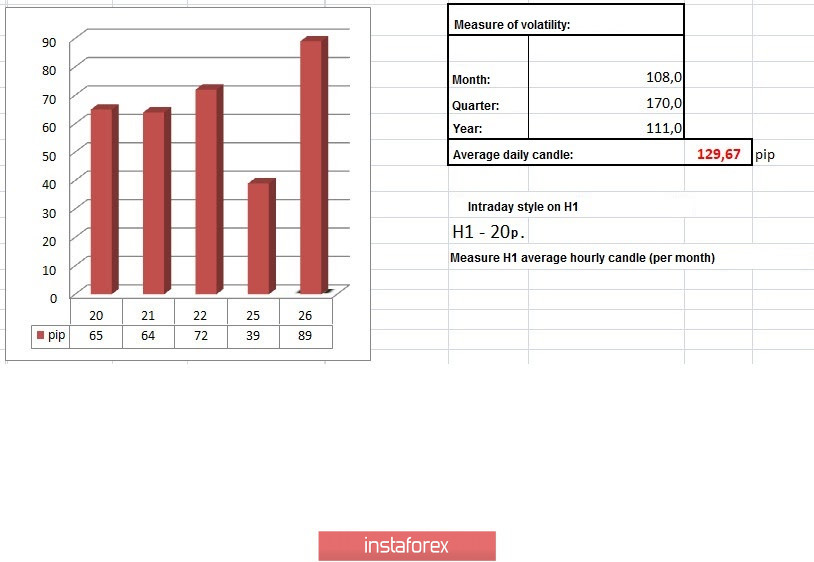
Volatility per week / Measurement of volatility: Month; Quarter; Year
Measurement of volatility reflects the average daily fluctuation, calculated for the Month / Quarter / Year.
(May 26 was built taking into account the time of publication of the article)
Volatility of the current time is 89 points, which is already more dynamic than in the previous period. It can be assumed that in the event of a breakdown in the area of interaction between trade forces, volatility will continue to grow, otherwise the existing scale of activity will end today.
Key levels
Resistance Zones: 1.2250; 1.2350 **; 1.2500; 1.2620; 1.2725 *; 1.2770 **; 1.2885 *; 1.3000; 1.3170 **; 1.3300 **; 1.3600; 1.3850; 1.4000 ***; 1.4350 **.
Support areas: 1.2150 **; 1.2000 *** (1.1957); 1.1850; 1.1660; 1.1450 (1.1411); 1.1300; 1.1000; 1.0800; 1.0500; 1.0000.
* Periodic level
** Range Level
*** Psychological level
**** The article is built on the principle of conducting a transaction, with daily adjustment