Analyzing Friday's trades:
EUR/USD on 1H chart
EUR/USD showed more pretense than actual movement on Friday. The single currency edged up throughout the day, which is quite difficult to describe in words. The volatility for the day amounted to 32 pips, indicating the complete absence of significant movements. It is hard to pinpoint the exact cause of such low volatility. European Central Bank President Christine Lagarde spoke on Friday, and several U.S. reports were published, although they were not crucial. The U.S. data turned out to be quite strong, particularly the Consumer Sentiment Index, but the dollar did not strengthen, and movements remained relatively muted.
As a result, the downtrend persists since the pair had previously settled below the ascending channel. The price traded in a flat range with low volatility for almost the entirety of last week. It is possible that the market has already started anticipating the ECB and Fed meetings, but it's difficult to expect too much from these events. At most, we can anticipate speeches from Federal Reserve Chair Jerome Powell and Lagarde. We can expect the euro to fall in the medium term.
EUR/USD on 5M chart
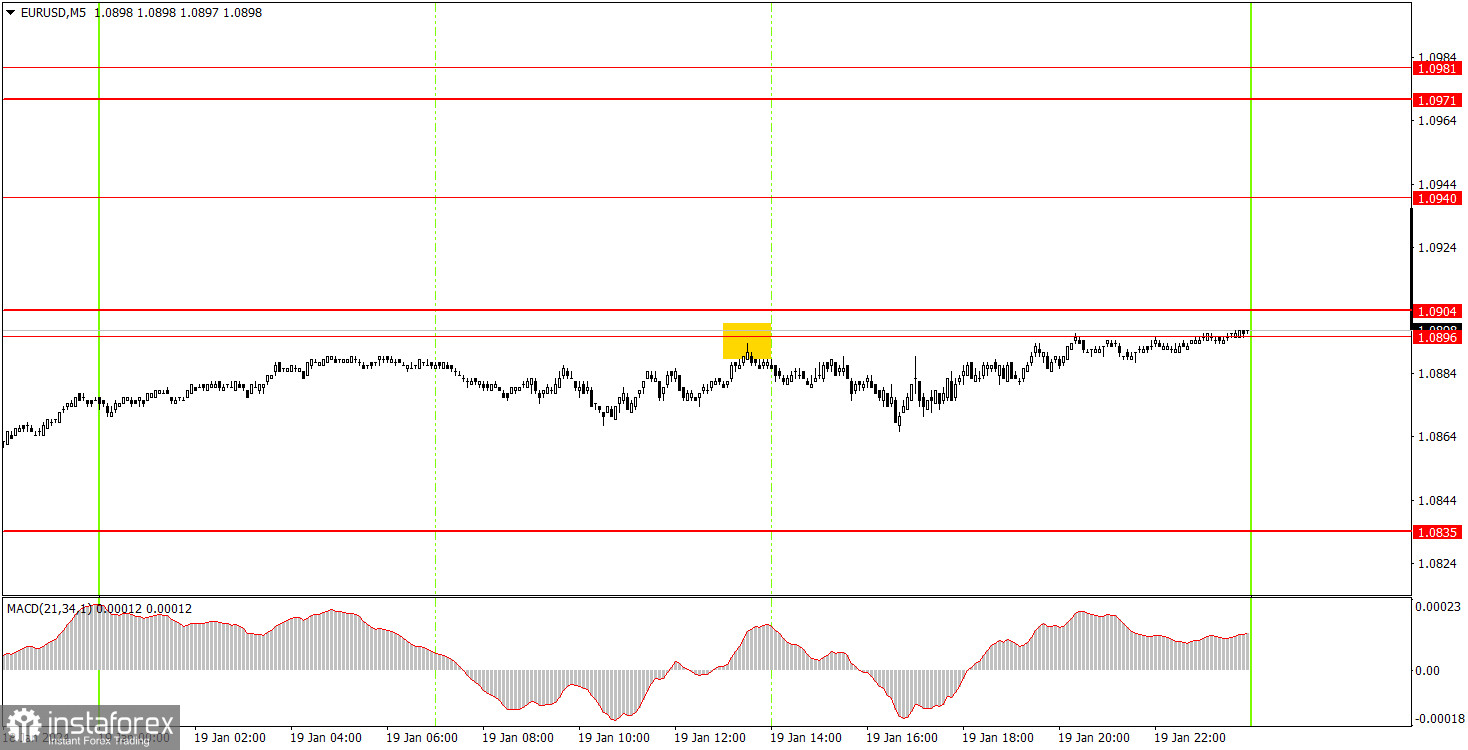
One trading signal was generated on the 5-minute timeframe, albeit with a slight error. Beginners could still execute this signal, but the price was able to move in the intended direction by just 15 pips. This was enough to set the Stop Loss at breakeven and traders could protect themselves. However, it's unlikely for traders to gain profit from this trade due to the low volatility.
Trading tips on Monday:
On the hourly chart, EUR/USD finally has a good chance of forming a downtrend since it settled below the ascending channel. Perhaps the market has finally changed its attitude towards the euro and the dollar, so the pair should continue to fall by another 500-600 pips.
On Monday, we expect further downward movement, as several sell signals were formed around the 1.0896-1.0904 area. Therefore, it is advisable to stay in short positions (or open new ones on a rebound) with a target of at least 1.0835. In the long term, we expect a much stronger decline in the pair.
The key levels on the 5M chart are 1.0733, 1.0767-1.0781, 1.0835, 1.0896-1.0904, 1.0940, 1.0971-1.0981, 1.1011, 1.1043, 1.1091, 1,1132-1.1145, 1.1184, 1.1241, 1.1279-1.1292. Lagarde is speaking again on Monday, but she probably will not share anything important. The announcement of the results of the first ECB meeting in 2024 will take place on Thursday, which may provide all the important information to the market.
Basic trading rules:
1) Signal strength is determined by the time taken for its formation (either a bounce or level breach). A shorter formation time indicates a stronger signal.
2) If two or more trades around a certain level are initiated based on false signals, subsequent signals from that level should be disregarded.
3) In a flat market, any currency pair can produce multiple false signals or none at all. In any case, the flat trend is not the best condition for trading.
4) Trading activities are confined between the onset of the European session and mid-way through the U.S. session, after which all open trades should be manually closed.
5) On the 30-minute timeframe, trades based on MACD signals are only advisable amidst substantial volatility and an established trend, confirmed either by a trendline or trend channel.
6) If two levels lie closely together (ranging from 5 to 15 pips apart), they should be considered as a support or resistance zone.
How to read charts:
Support and Resistance price levels can serve as targets when buying or selling. You can place Take Profit levels near them.
Red lines represent channels or trend lines, depicting the current market trend and indicating the preferable trading direction.
The MACD(14,22,3) indicator, encompassing both the histogram and signal line, acts as an auxiliary tool and can also be used as a signal source.
Significant speeches and reports (always noted in the news calendar) can profoundly influence the price dynamics. Hence, trading during their release calls for heightened caution. It may be reasonable to exit the market to prevent abrupt price reversals against the prevailing trend.
Beginning traders should always remember that not every trade will yield profit. Establishing a clear strategy coupled with sound money management is the cornerstone of sustained trading success.