Analyzing Wednesday's trades:
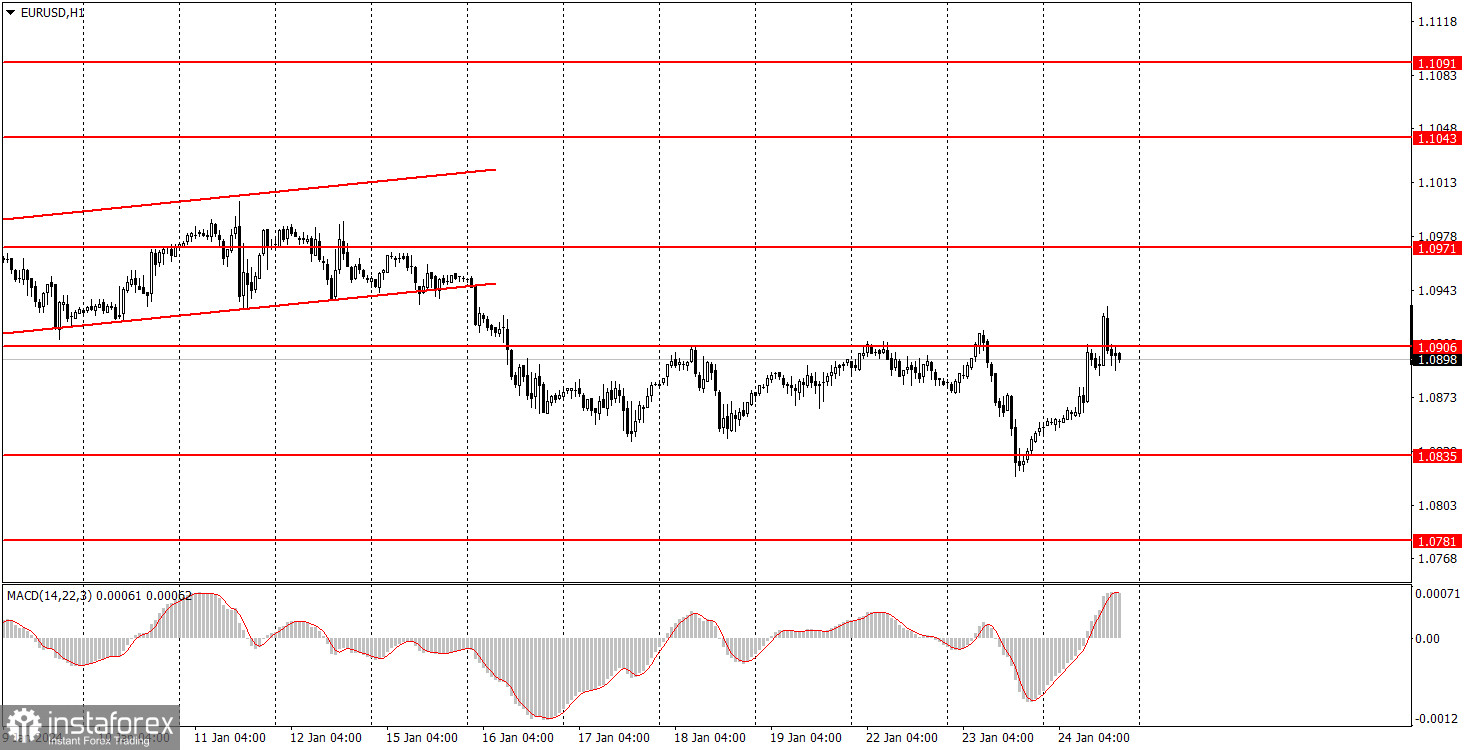
EUR/USD on 1H chart
On Wednesday, EUR/USD pushed higher within the flat range. The pair moved beyond the boundaries of the sideways channel at 1.0835-1.0906 for two days, but the sideways movement persists. The euro significantly fell on Tuesday, even in the absence of economic reports and fundamental events. On the other hand, the single currency provided additional positive trades that offset the previous day's decline. Let's analyze this movement.
In the morning, January business activity statistics in the services and manufacturing sectors were published in the European Union and Germany, with two of them exceeding expectations and two falling short. Therefore, there should have been no significant reaction to these reports since they turned out to be neutral. Nevertheless, the euro started to rise in the morning and continued to do so after the European reports were released.
In the second half of the day, the U.S. released its own PMI data, and all of them exceeded the forecasted values. What was the reaction? The dollar was up 25 pips. Once again, we observe a similar rise in the euro.
EUR/USD on 5M chart
On the 5-minute timeframe, trading signals were only formed at the very end of the uptrend. There was a somewhat imprecise rebound from the level of 1.0935, but that was on Tuesday. We advise you to have complete control of your trades and not leave them open overnight, with rare exceptions. Therefore, beginners could only open one long position when the price broke through the range of 1.0896-1.0906. However, the price did not reach the target level of 1.0940, and the trade closed at breakeven due to the Stop Loss.
Trading tips on Thursday:
On the hourly chart, EUR/USD still has a chance to form a new downtrend since it previously settled below the ascending channel. However, at the moment, the pair remains within the sideways channel of 1.0835-1.0906. Therefore, we expect the pair to fall further, but first, the price must leave this range.
On Thursday, you can expect any kind of movement, as there will be a multitude of macroeconomic and fundamental events. The price may reverse multiple times during the day, so you should focus on events and reports, as well as the time when they will be released, rather than specific price levels.
The key levels on the 5M chart are 1.0668, 1.0733, 1.0767-1.0781, 1.0835, 1.0896-1.0904, 1.0940, 1.0971-1.0981, 1.1011, 1.1043, 1.1091, 1.1132-1.1145, 1.1184. The European Central Bank policy decision is due Thursday, and ECB President Christine Lagarde's news conference follows later. The U.S. will release important reports on GDP in the fourth quarter, durable goods orders, and initial jobless claims.
Basic trading rules:
1) Signal strength is determined by the time taken for its formation (either a bounce or level breach). A shorter formation time indicates a stronger signal.
2) If two or more trades around a certain level are initiated based on false signals, subsequent signals from that level should be disregarded.
3) In a flat market, any currency pair can produce multiple false signals or none at all. In any case, the flat trend is not the best condition for trading.
4) Trading activities are confined between the onset of the European session and mid-way through the U.S. session, after which all open trades should be manually closed.
5) On the 30-minute timeframe, trades based on MACD signals are only advisable amidst substantial volatility and an established trend, confirmed either by a trendline or trend channel.
6) If two levels lie closely together (ranging from 5 to 15 pips apart), they should be considered as a support or resistance zone.
How to read charts:
Support and Resistance price levels can serve as targets when buying or selling. You can place Take Profit levels near them.
Red lines represent channels or trend lines, depicting the current market trend and indicating the preferable trading direction.
The MACD(14,22,3) indicator, encompassing both the histogram and signal line, acts as an auxiliary tool and can also be used as a signal source.
Significant speeches and reports (always noted in the news calendar) can profoundly influence the price dynamics. Hence, trading during their release calls for heightened caution. It may be reasonable to exit the market to prevent abrupt price reversals against the prevailing trend.
Beginning traders should always remember that not every trade will yield profit. Establishing a clear strategy coupled with sound money management is the cornerstone of sustained trading success.