GBP/USD 5M
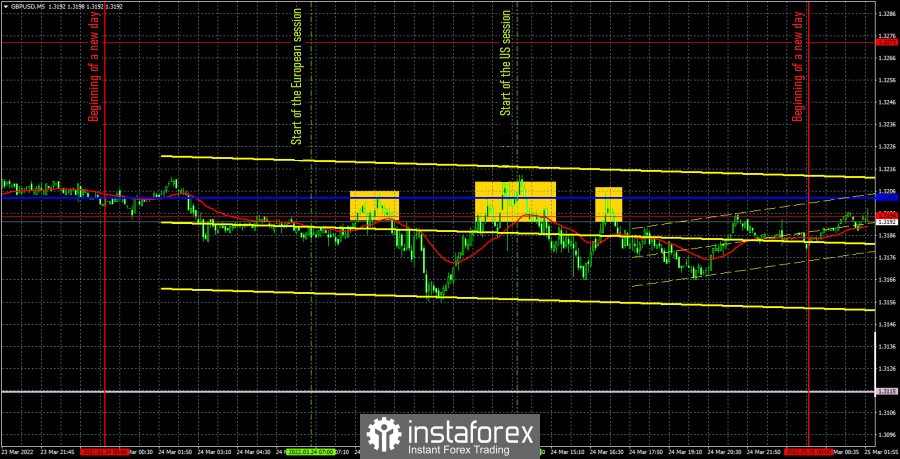
The GBP/USD currency pair was also trading flat on Thursday. With the help of the Ichimoku indicator, a large number of false signals were avoided. The Kijun-sen line moved to the 1.3203 level during the day and formed a resistance area with the extreme level of 1.3194. It was from this area that the price bounced three times during the day, forming sell signals. In general, there were several secondary reports in the UK and the United States today. Data on business activity in Britain could even provoke an intraday strengthening of the British currency, as the next round of growth began at the time when these data were published. But in general, the pair was still trading flat, with very low volatility. No more than 60 points. Thus, these reports did not make much weather for traders. It should also be noted that the reports themselves were not strong enough. In the service sector, business activity increased from 60.5 to 61.0, that is, the change was small. In the sphere of production, it decreased from 58.0 to 55.5, and so this report could not even theoretically provoke the pound's growth. Therefore, we have great doubts that this was a market reaction at all, and not just a coincidence.
Now let's take a closer look at trading signals. As already mentioned, the pair bounced three times from the area of 1.3194-1.3203. In the first and second cases, it went down after the formation of signals of 30 and 20 points. Therefore, both short positions closed at breakeven on Stop Loss. The third sell signal should no longer be worked out, since before that two signals near the same area turned out to be false.
COT report:
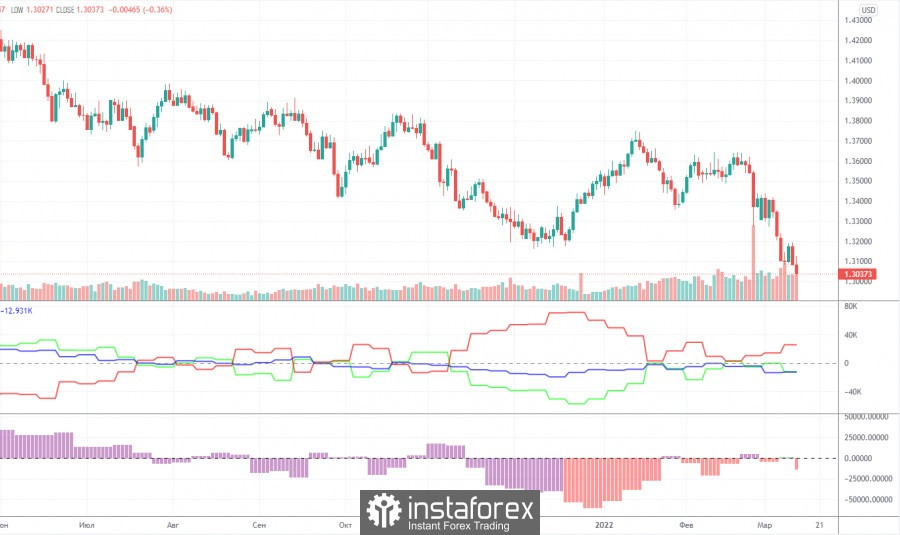
The latest Commitment of Traders (COT) report showed an increase in the bearish mood among commercial traders. However, in general, the mood of the major players has changed too often in recent months, which is clearly seen by the two indicators in the chart above: they are constantly changing the direction of their movement. At the moment, the number of open long positions is less than the number of short positions by almost 30,000. Although two weeks ago their number was almost the same. Earlier, we concluded that major players could not make a decision regarding the British pound, but we also drew attention to the fact that with the complication of the geopolitical situation, the demand for the US currency grew very much, which could "cross out" the data of COT reports. However, now the current picture of what is happening in the foreign exchange market is already beginning to correspond to the COT reports. Thus, the pound may now be at the beginning of a new round of decline. But, since in recent weeks it has only been falling, now another upward correction may follow, and then everything will depend on the geopolitical background. Like the mood of traders, the market situation can change rapidly. A month ago, few people believed that an armed conflict could break out in the center of Europe on a huge territory. Therefore, you need to be prepared for everything, and use COT reports only as an additional factor of assessment and forecasting.
We recommend to familiarize yourself with:
Overview of the EUR/USD pair. March 25. The market has finally stopped and is waiting for the results of the EU summit.
Overview of the GBP/USD pair. March 25. The British pound has found a point of equilibrium. But how long will it stay in it?
Forecast and trading signals for EUR/USD on March 25. Detailed analysis of the movement of the pair and trading transactions.
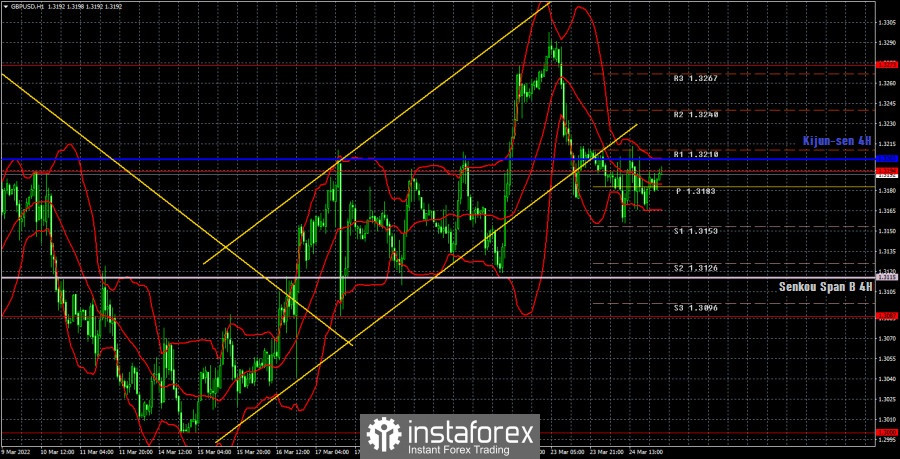
GBP/USD 1H

The technical picture on the hourly timeframe continues to look very strange. The pair has settled below the ascending channel, but it cannot continue falling yet. Thus, a transition to a horizontal channel is possible, which is still only being formed. If we talk about downward prospects, then the price first needs to fall to the Senkou Span B line, and then overcome it. Without this, then the pound cannot start a new fall. And the bulls have already shown their inability to maintain the demand for the pound for a long time. We highlight the following important levels on March 25: 1.3000, 1.3087, 1.3194, 1.3273, 1.3367. The Senkou Span B (1.3115) and Kijun-sen (1.3203) lines can also be signal sources. Signals can be "bounces" and "breakthroughs" of these levels and lines. It is recommended to set the Stop Loss level to breakeven when the price passes in the right direction by 20 points. The lines of the Ichimoku indicator can move during the day, which should be taken into account when determining trading signals. There are also support and resistance levels on the chart that can be used to take profits on transactions. There are no important events scheduled for Friday in the UK and the United States. The report on retail sales in Britain can hardly be considered as such. So today the pair can spend another day in a low-volatility movement.
Explanations for the chart:
Support and Resistance Levels are the levels that serve as targets when buying or selling the pair. You can place Take Profit near these levels.
Kijun-sen and Senkou Span B lines are lines of the Ichimoku indicator transferred to the hourly timeframe from the 4-hour one.
Support and resistance areas are areas from which the price has repeatedly rebounded off.
Yellow lines are trend lines, trend channels and any other technical patterns.
Indicator 1 on the COT charts is the size of the net position of each category of traders.
Indicator 2 on the COT charts is the size of the net position for the non-commercial group.