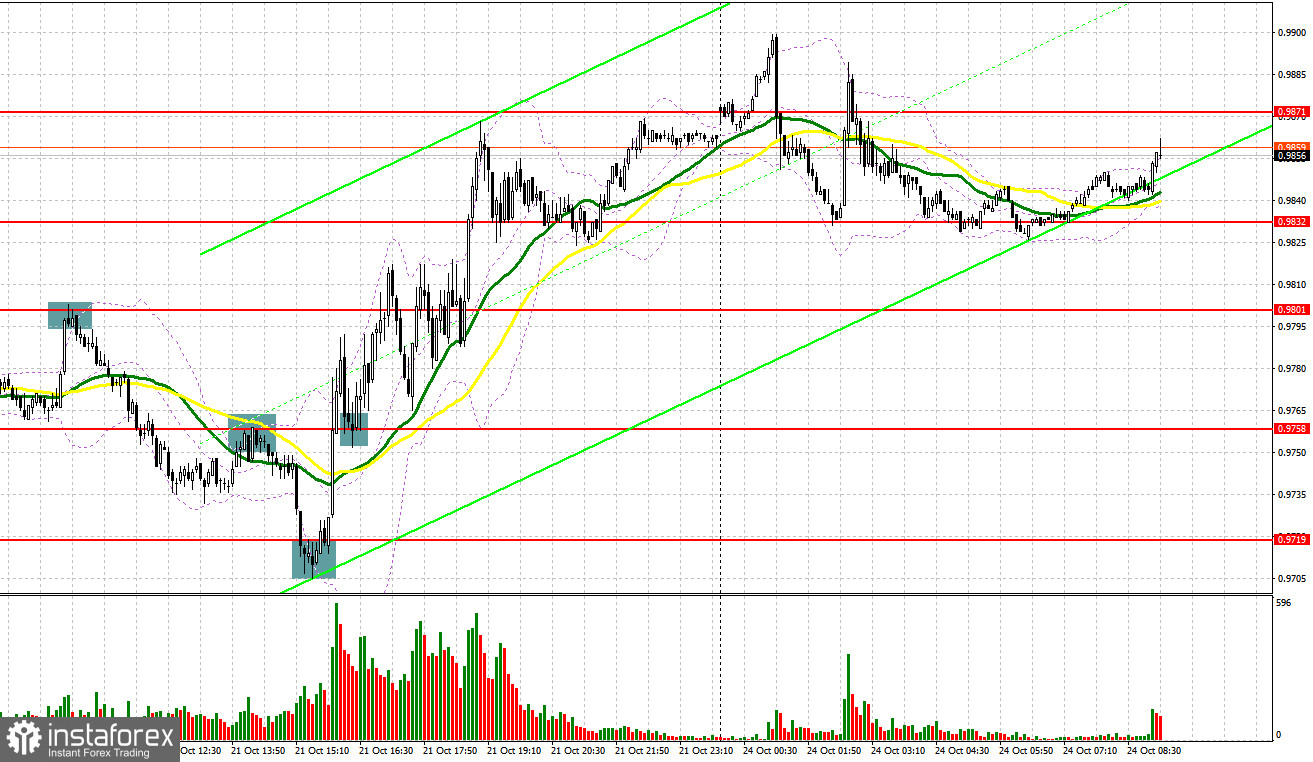
On Friday, traders received a lot of signals to enter the market. Let us take a look at the 5-minute chart to clear up the market situation. Earlier, I asked you to pay attention to the level of 0.9801 to decide when to enter the market. A rise to the resistance level led to a false breakout and a sell signal. As a result, the pair dropped to 0.9758 and then slid even lower, allowing traders to earn about 50 pips. In the second part of the day, the pair upwardly tested 0.9758, thus forming a sell signal. Thus, the pair declined by 40 pips. Bulls became active only at 0.9719. They protected the area and formed a buy signal. The pair increased by 50 pips which allowed it to break 0.9758 and consolidate above it. After that, traders received another buy signal. The pair rose by 50 pips.
Conditions for opening long positions on EUR/USD:
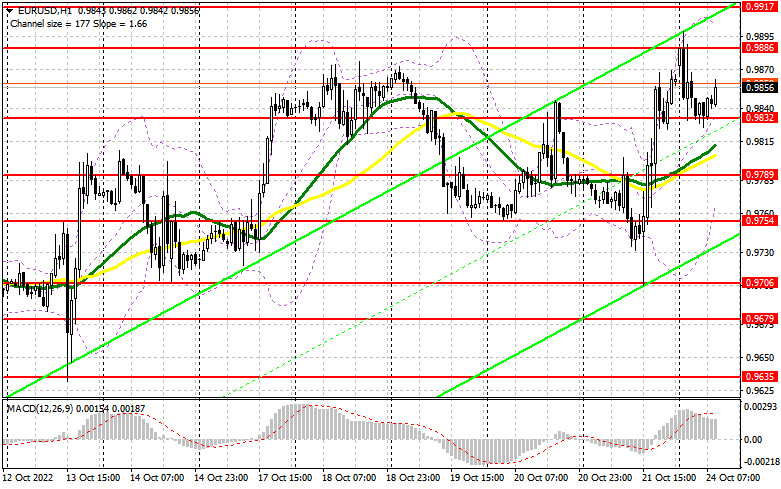
Whispers about a further key interest rate hike and a more aggressive approach are boosting the euro, allowing buyers to return to the market. However, today's data on the eurozone's business activity may cap the euro's upward potential. Traders should pay attention to the services, manufacturing, and composite PMI reports from the eurozone. All three indicators are below 50 points, which points to contraction. If the indicators decrease more, the euro is likely to fall. If the predictions come true, only a false breakout of the support level of 0.9832, formed during the Asian trade, will allow traders to open long positions with the target at 0.9886. If the price breaks this level and downwardly tests it, bulls are likely to regain control over the market. Notably, the pair will have a chance to do so only closer to the US trade, when the US is planning to disclose its PMI figures. To encourage traders to buy the euro at the beginning of the week and ahead of the ECB meeting, the US PMI data should be well below the forecast. A breakout of 0.9986 will affect bears' stop orders and form an additional buy signal with the target at 0.9917. This will intensify the bullish trend initiated on October 13. If the price exceeds 0.9917, it may climb to 0.9948, where it is recommended to lock in profits. If the euro/dollar pair drops and buyers fail to protect 0.9832, they will lose control over the market. In the event of this, pressure on the asset will rise and the pair will start trading sideways. It will be better to go long after a false breakout of 0.9786. Traders may also buy the asset just after a bounce off 0.9754 or lower from 0.9706, expecting a rise of 30-35 pips.
Conditions for opening short positions on EUR/USD:
Bears fail to reach their goal and lost control over the pair at the end of the previous week. Now, they should push the price below 1.9832. This will seriously affect buyers' strategy developed after a rapid rise on October 17. However, they should protect a new resistance level of 0.9886 formed early today. Traders may initiate sell orders after a false breakout of 0.9886, which will give a perfect entry point. In this case, the price may return to 0.9832. If the price settles below 0.9832 and shows an upward test amid weak data from the eurozone, traders may sell the asset with the target at 0.9789. The farthest target is located at 0.9754, where it will be wise to lock in profits. If the euro/dollar pair increases during the European session and bears fail to protect 0.9886, demand for the asset will mount, thus causing a stronger upward correction. In this case, traders should avoid selling. They may go short after a false breakout of 0.9917. It is also possible to sell the asset after a rebound from the weekly high of 0.9948 or higher – from 0.9990, expecting a drop of 30-35 pips.
COT report
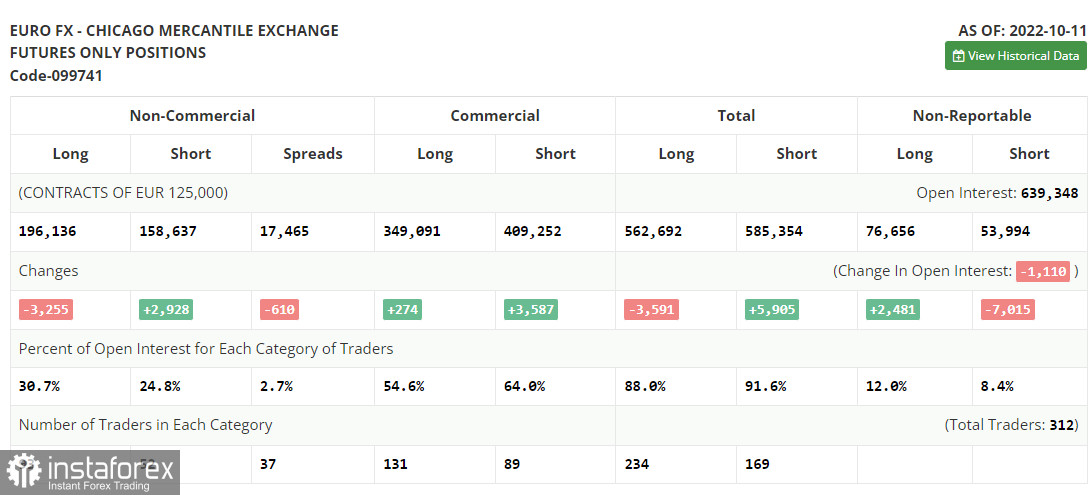
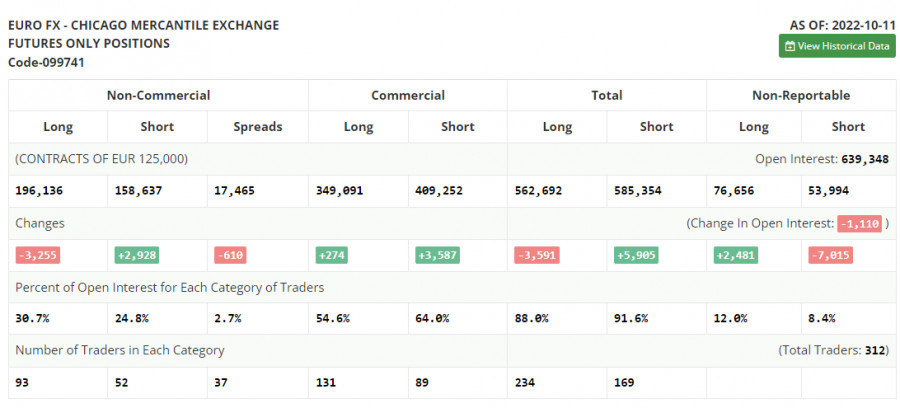
According to the COT report from October 11, the number of long positions tumbled, whereas the number of short positions increased. The fact is that traders were getting ready for the US inflation and retail sales reports. It is obvious that the Fed finds it difficult to cap inflation, which is reflected in the report for September. The US inflation slackened just by 0.1% compared to the previous reading. It means that the Fed's approach will remain the same or become even more aggressive. Notably, we haven't seen the euro sell-off below the parity level for a long time already. What is more, even the geopolitical situation and the key interest rate hike by the Fed will hardly push the price lower. That is why it is a good reason to start buying the euro in the middle term. The COT report unveiled that the number of long non-commercial positions slumped by 3,255 to 196,136, whereas the number of short non-commercial positions increased by 2,928 to 158,637. At the end of the week, the total non-commercial net position remained positive and amounted to 37,499 against 43,682. This indicates that investors are benefiting from the situation and continue to buy the cheap euro below parity. They are also accumulating long positions, expecting the end of the crisis and the pair's recovery in the long term. The weekly closing price decreased to 0.9757 from 1.0053.
Signals of indicators:
Moving Averages
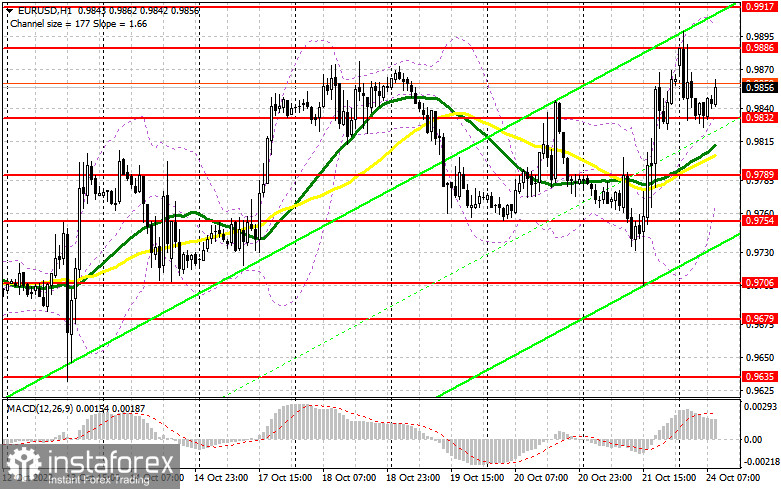
Trading is performed above the 30- and 50-day moving averages, which points to bulls' attempts to return to the market.
Note: The period and prices of moving averages are considered by the author on the one-hour chart, which differs from the general definition of the classic daily moving averages on the daily chart.
Bollinger Bands
In case of a rise, the resistance level will be located at the upper limit of the indicator – at 0.9895. If the euro/dollar pair declines, the lower limit of the indicator located at 0.9775 will act as support.
Description of indicators
- Moving average (moving average, determines the current trend by smoothing volatility and noise). The period is 50. It is marked in yellow on the chart.
- Moving average (moving average, determines the current trend by smoothing volatility and noise). The period is 30. It is marked in green on the graph.
- MACD indicator (Moving Average Convergence/Divergence - convergence/divergence of moving averages). A fast EMA period is 12. A slow EMA period is 26. The SMA period is 9.
- Bollinger Bands. The period is 20.
- Non-profit speculative traders are individual traders, hedge funds, and large institutions that use the futures market for speculative purposes and meet certain requirements.
- Long non-commercial positions are the total number of long positions opened by non-commercial traders.
- Short non-commercial positions are the total number of short positions opened by non-commercial traders.
- The total non-commercial net position is a difference in the number of short and long positions opened by non-commercial traders.